Slide 5 of 13 from Management Report PowerPoint Template
KPIs Slide with Columns Chart
Key Performance Indicators Slide for Management Reports
- Chart
- Bar Vertical
- Kpi Reporting Slide
- 16:9
- 100% Editable
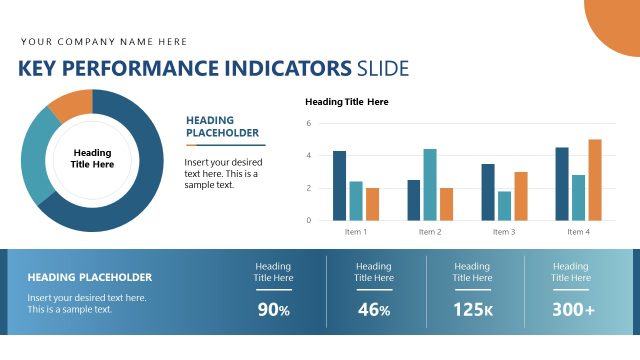
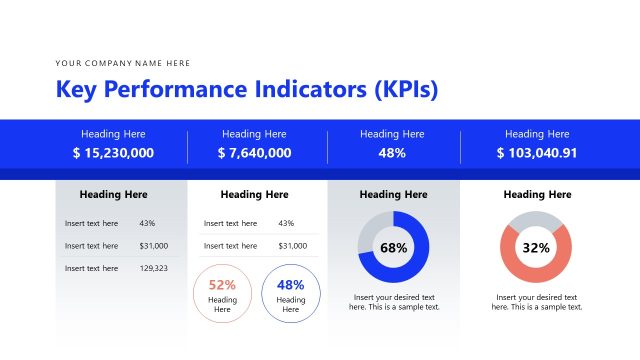
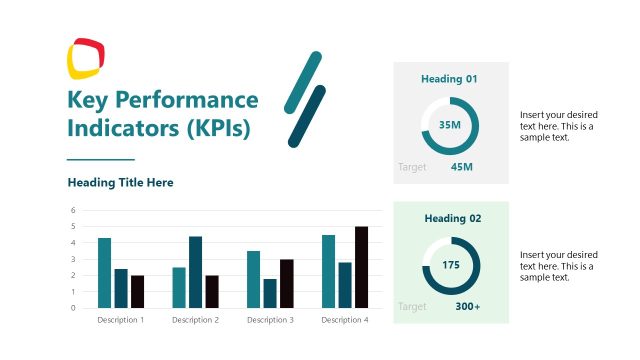
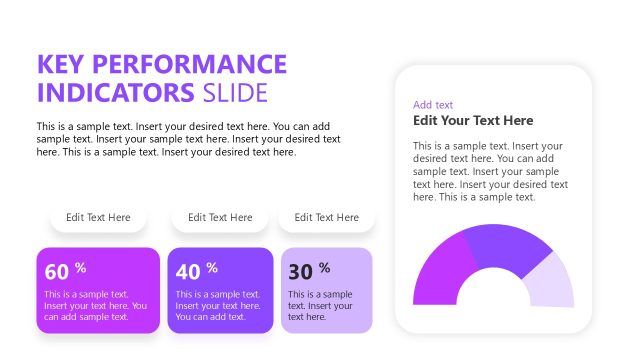
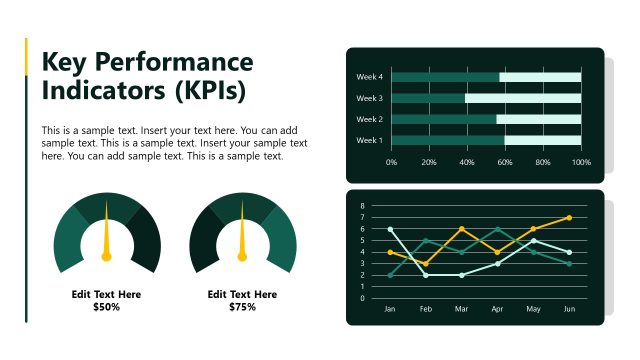
The Key Performance Indicators Slide from the Management Report PowerPoint Template offers a clear visual format for presenting financial and operational metrics. This slide layout includes editable shapes and vector icons to highlight bar and circular charts, making it suitable for corporate presentations and business presentation slide decks focused on KPI reporting and project outcome reviews.
What’s on This Slide
The layout features a bar chart on the left and a circular chart on the right. The bar chart has four vertical bars labeled M1 to M4, with varying heights and colors: dark blue and green. Below the bar chart, there are three text placeholders for percentage values, each aligned to the left. The circular chart displays segments with percentages and a central label, all surrounded by a circular border. The top section contains a title placeholder, while the overall background is a light color with a dark blue footer. Visual hierarchy emphasizes the charts and title.
How to Use It
This layout serves to present key performance indicators in a business report. It fits well after an executive summary or business overview, providing a visual snapshot of performance metrics. This slide is suitable for reporting financial results, operational efficiency, or project outcomes. It can be used in meetings to discuss progress and areas for improvement, making it valuable for stakeholders and management teams.
Text Placeholders & Capacity
Keep your copy within these limits so it fits without resizing. Node body slots can hold roughly 4-5 words each.
| Placeholder | Count | Max characters (approx.) |
|---|---|---|
| Slide title | 1 | 30 |
| Item body | 4 | 20 |
| Item heading | 4 | 10 |
| Chart title | 1 | 30 |
| Body paragraph | 1 | 150 |
Slide Keywords
Download unlimited PowerPoint templates, charts and graphics for your presentations with our annual plan.
DOWNLOADReturn to Management Report PowerPoint Template.