Laffer Curve PowerPoint Template
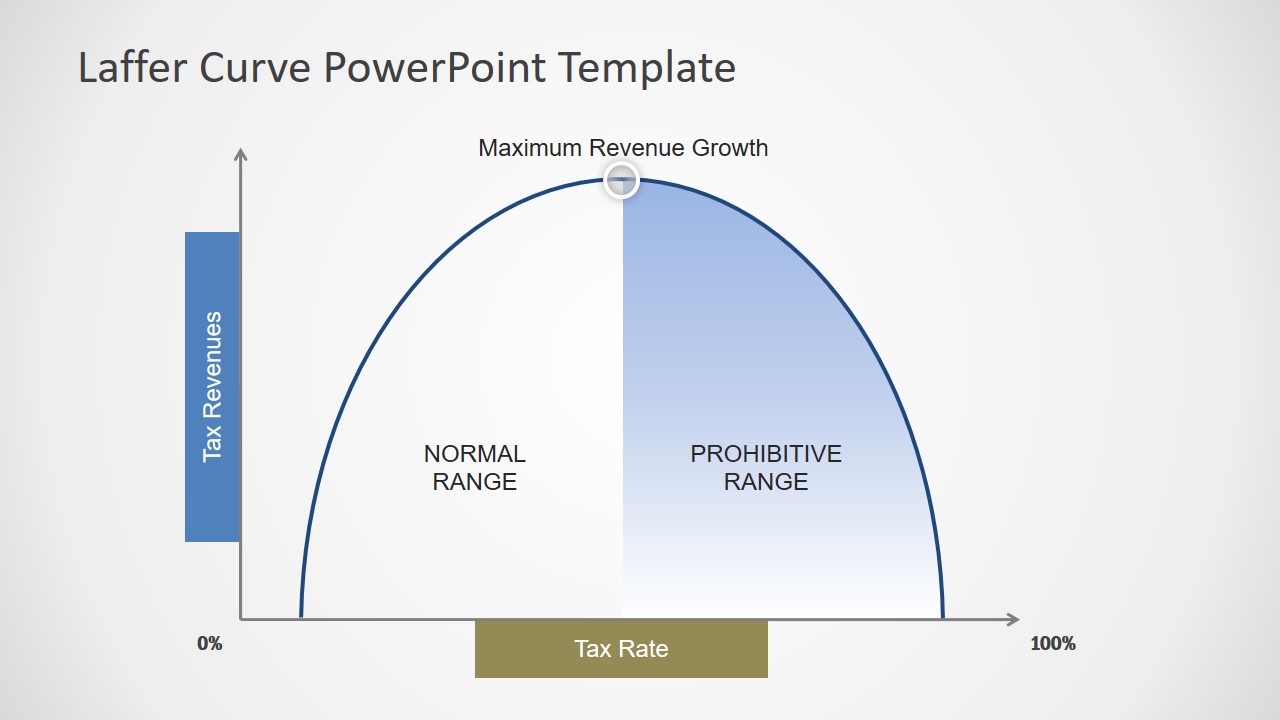
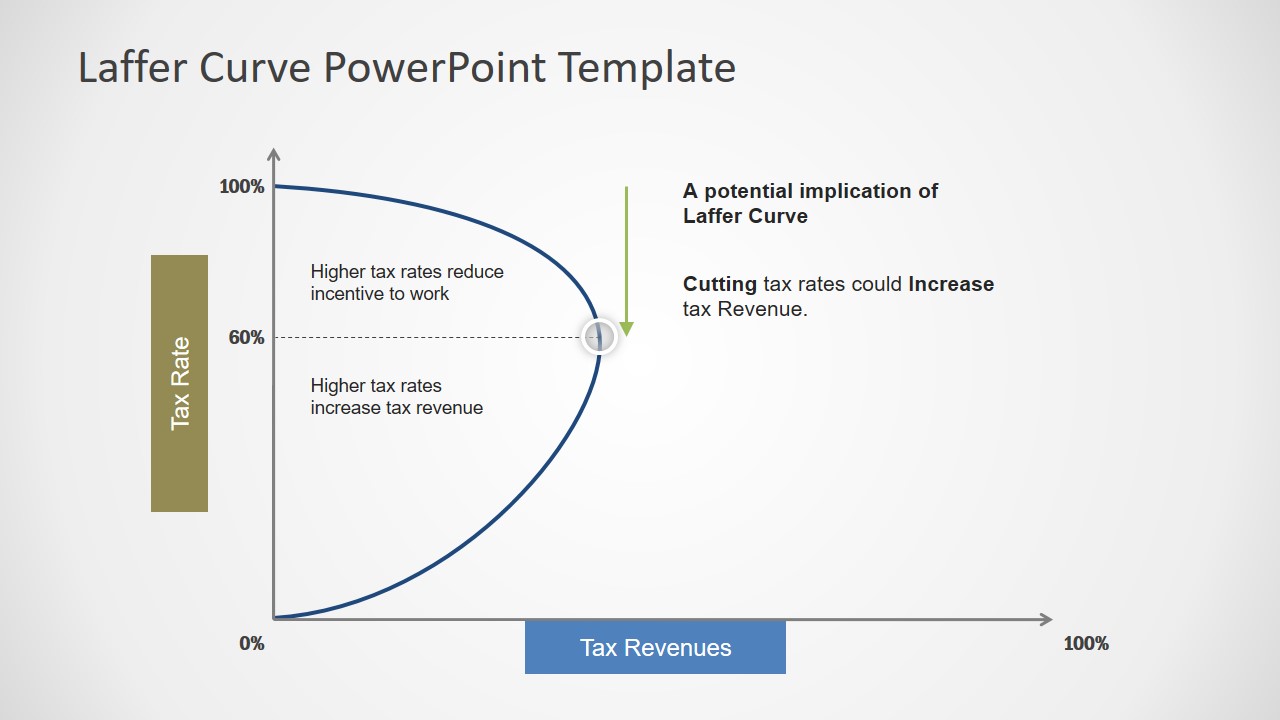
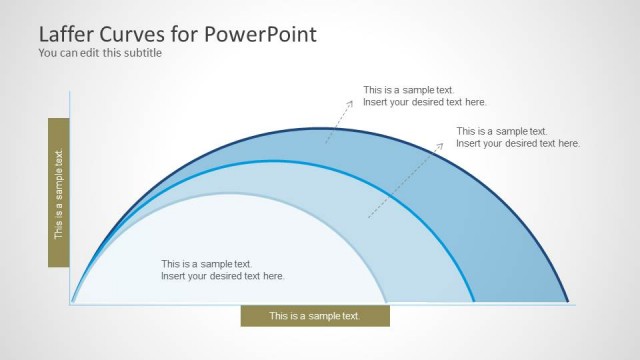
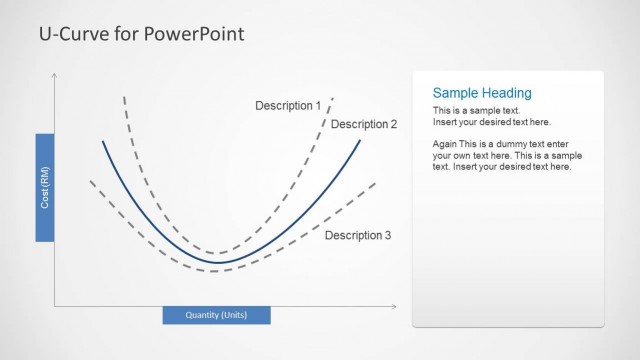
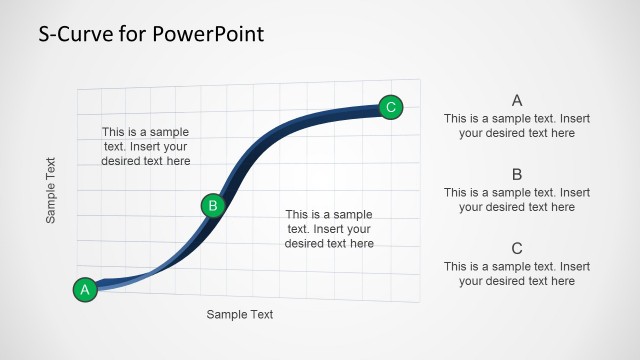
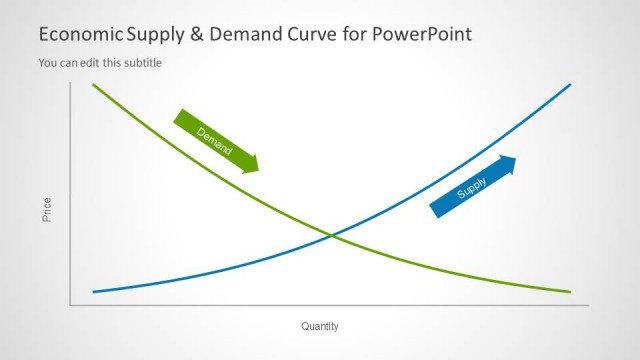
The Laffer Curve PowerPoint Template presents two slide layouts of tax and revenue graphs. These slides display a correlation between tax rates and tax revenue. The graphs of Laffer Curve are useful for discussing certain tax rate which government should impose. Here, the two slides display tax rate on both X and Y axis. This planning of tax rate may have different meanings. Although a tax rate is different for each country. But economy principle suggests lower rate would increase production and growth. Because at 0% tax, government cannot collect any amount while at 100%, companies will be out of business.
The Laffer Curve PowerPoint Template provides two simple graphs – A concept by Arthur Laffer against tax increase by government. This template could be used to demonstrate government tax policies and control over foreign corporation. Alternatively, download Laffer Curves for PowerPoint for three move version of this graph. The slide layouts of Laffer Curve templates are fully editable. Therefore, users can choose a graph and customize it according to presentation theme.
