Data Driven Bar Chart Dashboard Slide Design
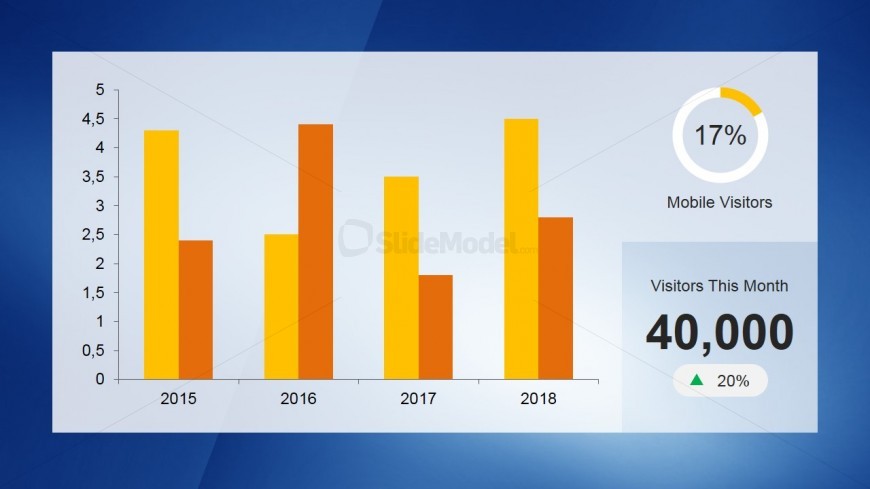
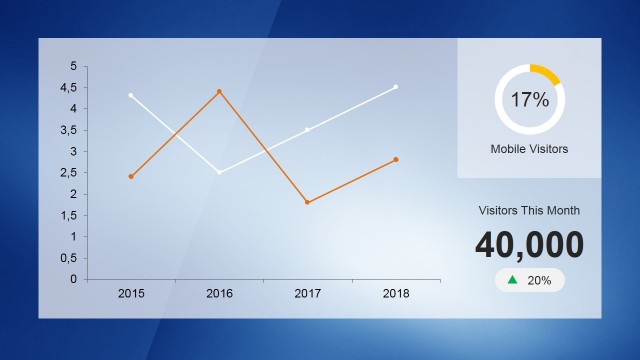
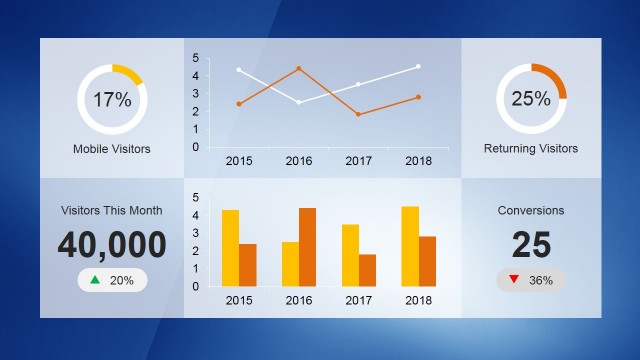
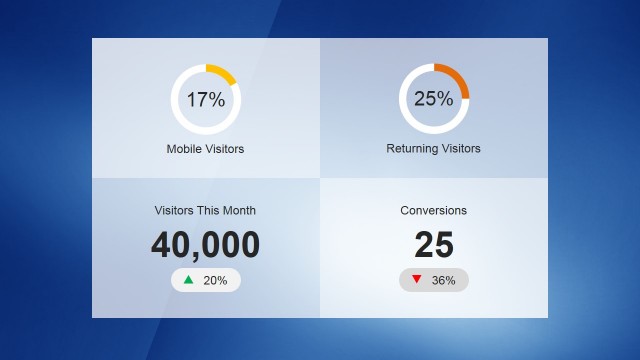
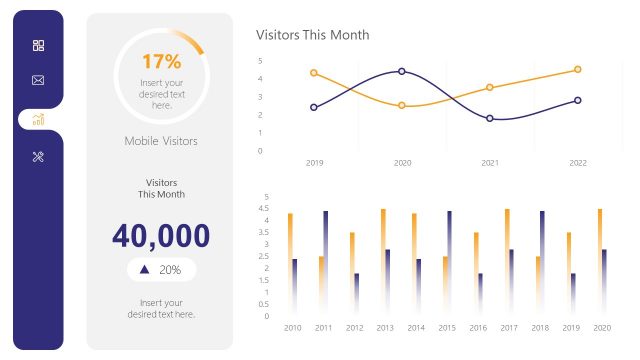
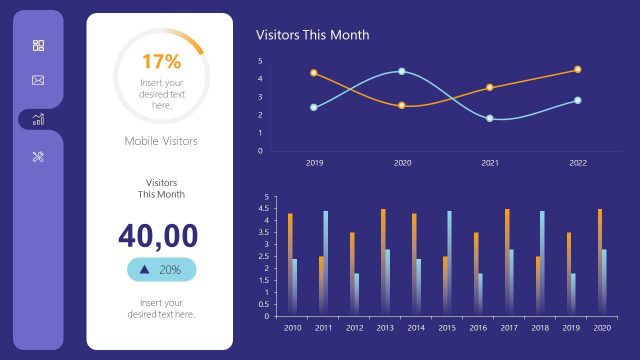
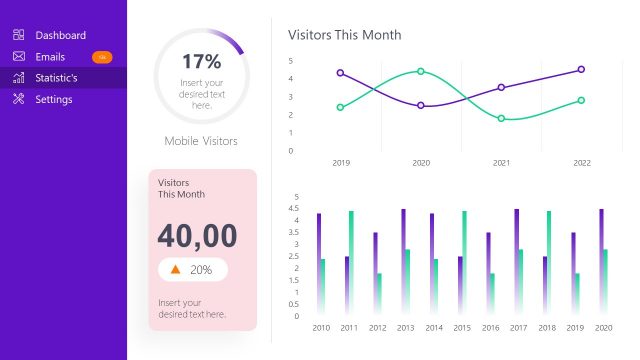
This Office template shows a Data Driven Bar Chart Dashboard Slide Design. It features a bar graph, a donut chart and figure placeholders. The bar chart contains four editable boxes where years can be inserted. The donut chart is labelled Mobile Visitors and the figure directly below it is labelled Visitors This Month.
The Dashboard design is a creative visual representation of KPIs. Future forecast can be presented using the data driven charts. The presenter can edit the figures and re-calculate the values through MS Excel. The visual appeal of the slide design will facilitate the easy grasp of the subject matter discussed.
Return to KPI Dashboard Template for PowerPoint.