Slide 1 of 2 from Investor Timeline Slides for PowerPoint
6131-03-investor-investor-timeline-1
Investor Timeline Diagram for Presentations
- Diagram
- Timeline Horizontal
- Timeline Slide
- 16:9
- 100% Editable
The Investor Timeline Diagram from the Investor Timeline Slides for PowerPoint template provides a clear horizontal timeline layout ideal for illustrating project timelines and investment roadmaps. This slide uses editable shapes and vector icons to mark annual milestones from 2013 to 2017, making it suitable for corporate presentations and pitch deck templates focused on strategic planning and funding rounds.
What’s on This Slide
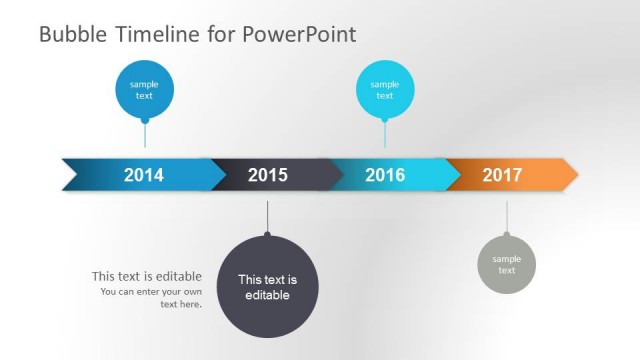
The layout features a horizontal timeline with circular milestone markers representing the years 2013 to 2017. Each year is labeled with a number positioned above the corresponding circle. The circles are filled with varying shades of blue and gray, with dotted paths connecting them. Text placeholders are present within each circle for additional details, aligned centrally. The background is light, enhancing the visibility of the elements. The overall composition is balanced, with a clear flow from left to right, indicating progression over the years.
How to Use It
This layout serves as a timeline diagram, effectively illustrating annual milestones for an investor roadmap. It fits well in presentations discussing project timelines or investment strategies. The structure is suitable for showcasing key events or achievements over a specified period. It can be used in business contexts such as funding rounds, project launches, or strategic planning discussions. The layout allows for easy updates to reflect changing timelines or milestones, making it versatile for various presentations.
Text Placeholders & Capacity
Keep your copy within these limits so it fits without resizing. Node body slots can hold about 10 words each.
| Placeholder | Count | Max characters (approx.) |
|---|---|---|
| Item heading | 5 | 30 |
| Item body | 5 | 50 |
| Slide title | 1 | 40 |