Slide 1 of 2 from Hockey Stick PowerPoint Template
Hockey Stick Presentation Template Slide
Hockey Stick Growth Chart Slide
- Diagram
- Other
- Concept Explanation Slide
- 16:9
- 100% Editable
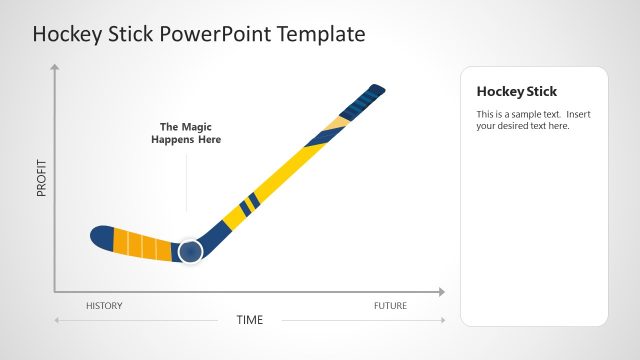
The Hockey Stick Growth Chart slide from the Hockey Stick PowerPoint Template provides a clear visual for illustrating profit trends over time, ideal for financial forecasts and investment presentations. This slide layout includes editable shapes and vector icons to highlight key growth points, making it a practical choice for business presentations focused on growth strategies and future profit projections.
What’s on This Slide
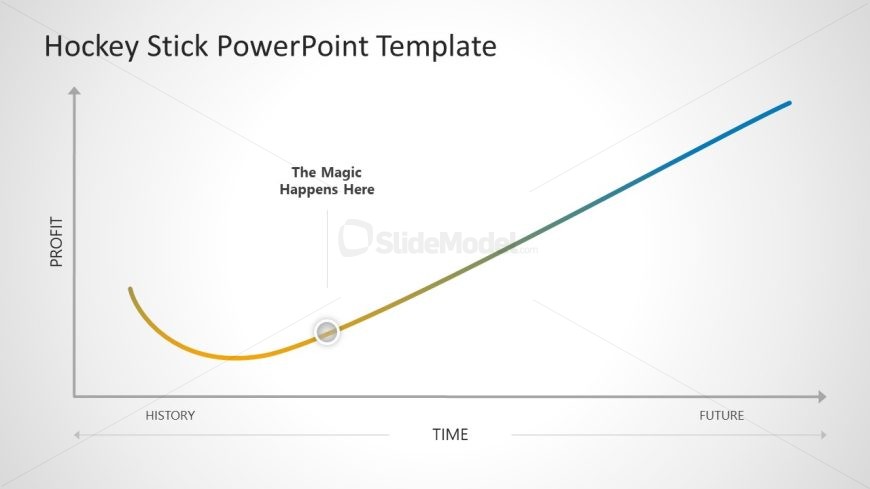
The slide features a hockey stick growth chart with a curved line representing profit over time. The left side indicates 'HISTORY' while the right side shows 'FUTURE.' The vertical axis is labeled 'PROFIT.' A circular node is placed along the curve, highlighting a point where 'The Magic Happens Here' is inscribed. The background is light with a subtle gradient, and the color scheme transitions from yellow to green to blue along the curve. Text placeholders exist for the title and subtitle, positioned at the top and center respectively.
How to Use It
This layout serves as a visual representation of growth trajectories, commonly used in business presentations to illustrate expected profit increases over time. It is effective for discussing financial forecasts, investment opportunities, or business growth strategies. This slide fits well at the beginning of a presentation to set the stage for detailed discussions on growth metrics or in a financial analysis context. It is not suitable for detailed data comparisons or complex multi-variable analyses.
Text Placeholders & Capacity
Keep your copy within these limits so it fits without resizing. Title slot has moderate space, roughly 5-6 words each.
| Placeholder | Count | Max characters (approx.) |
|---|---|---|
| Slide title | 1 | 30 |
| Item heading | 1 | 30 |
Slide Keywords
Download unlimited PowerPoint templates, charts and graphics for your presentations with our annual plan.
DOWNLOADReturn to Hockey Stick PowerPoint Template.