Growth & Decay PowerPoint Template is a business template which provides slides to help you present an analysis of growth and decline.
This template can be used for a variety of topics ranging from finance, business, marketing, product lifecycle analysis, etc.
You can compare quarterly performance, display financial forecasts and even elaborate upon the rise and fall of stock prices with the help of generic growth and decay slides, which can be customized to suit your needs.
What’s inside this template
Example presentation scenarios
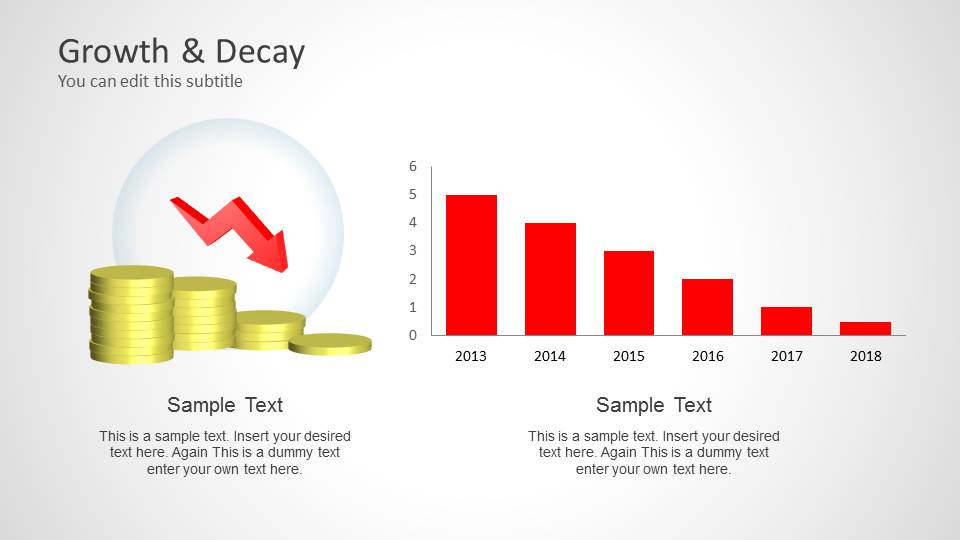
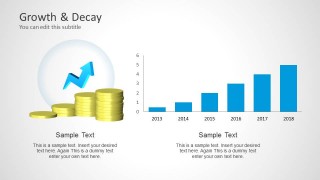
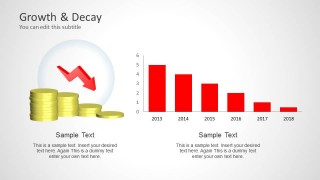
- A finance manager can present revenue movement to executives using the rising bar chart for growth years and the falling bar chart for decline periods.
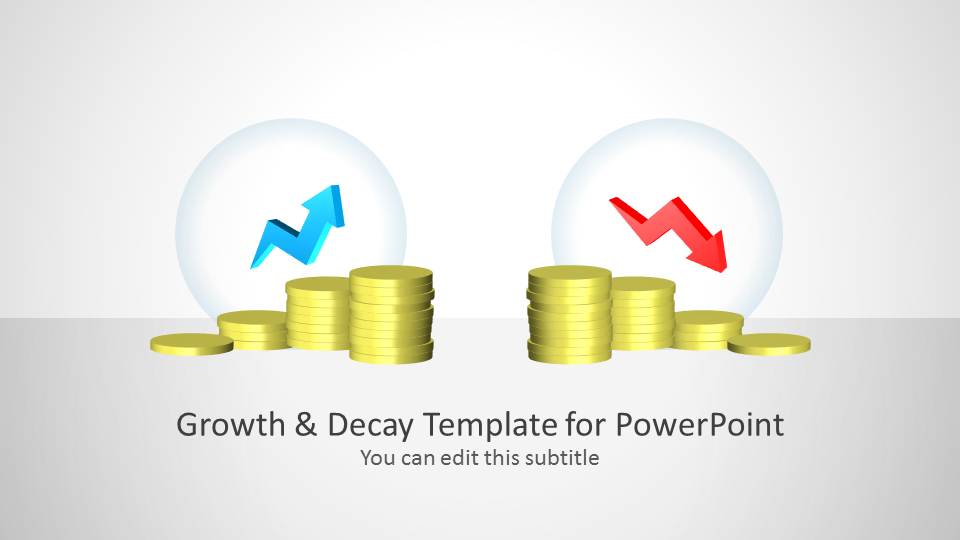
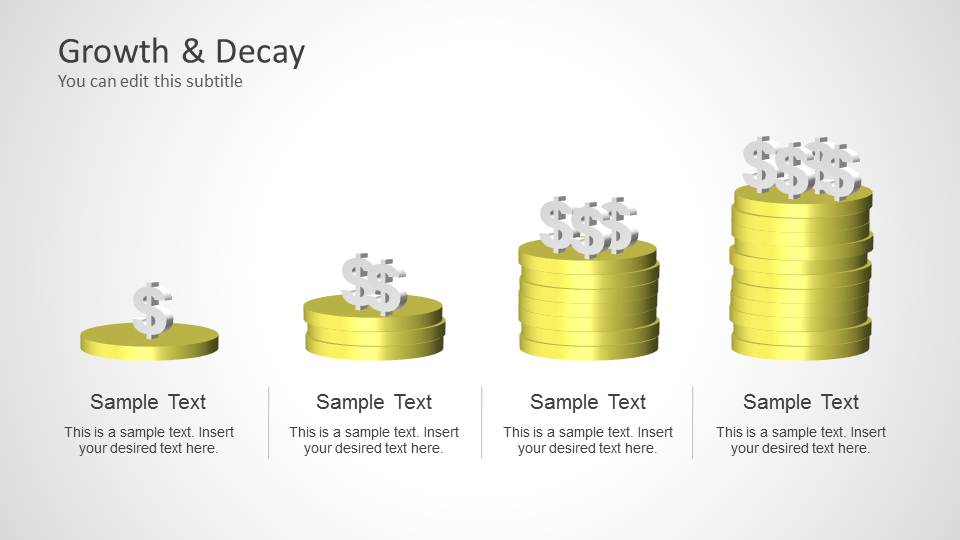
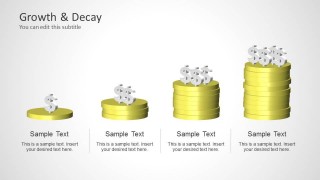
- A business analyst can explain market expansion or contraction to a leadership team with the four-step coin stack comparison and paired growth-decay cover metaphor.
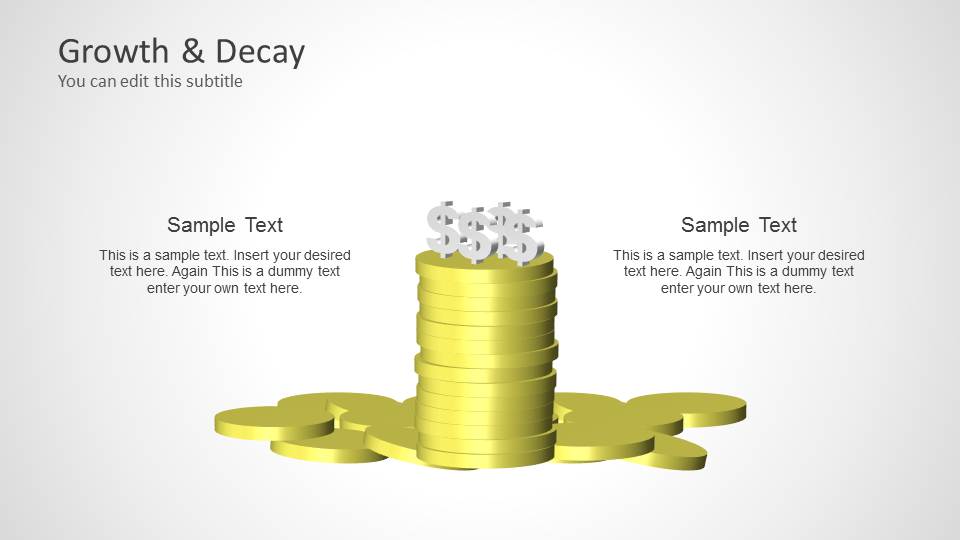
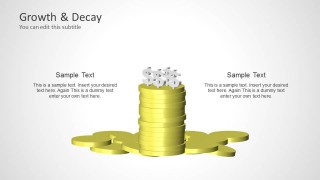
- A consultant can summarize a client performance diagnosis by using the central coin stack callout slide to compare two drivers behind financial change.
- A marketing manager can discuss product lifecycle momentum with the growth illustration for adoption gains and the decay chart for reduced demand or declining engagement.
Features
- 100% editable presentation template
- Compatible with Microsoft PowerPoint and Google Slides
- Scalable vector shapes, icons and illustrations
- AI-Ready for Microsoft Copilot and Claude
- Instant access and download
Frequently asked questions
Q: How should I structure a presentation around growth and decay using this template?
A: Start with the cover to frame the topic as a movement story, then use the four-step coin stack slide to show the sequence of increase or value creation. Follow with the callout slide for explanation, and use the rising and falling bar chart slides only when the audience needs numeric proof.
Q: Who benefits most from this growth and decay visual approach?
A: This template works best for presenters who need to explain direction of change without building a long financial report. Finance managers, business analysts, consultants, and marketing leads can use the coin stacks and year-based bar charts to make revenue, demand, cost, or market movement easier to compare.
Q: Why use coins, arrows, and bar charts instead of plain text bullets?
A: The coin stacks create an immediate financial metaphor, while the blue upward arrow and red downward arrow separate positive and negative movement at a glance. The bar charts add evidence after the metaphor, so the audience first understands the direction and then sees the supporting trend.

Growth & Decay PowerPoint Template
5-slide PowerPoint presentation template for growth and decay analysis with coin stacks and bar charts
Growth & Decay PowerPoint Template is a 5-slide business presentation template for explaining increases and declines in financial or operational results. Visible layouts include a growth-versus-decay cover, four-step coin stack comparison, two-callout money illustration, rising bar chart, and falling bar chart. Chart data can be edited as an Excel spreadsheet in PowerPoint.

 Loading...
 Microsoft PowerPoint
  Microsoft Copilot
  Claude for PowerPoint
 Other formats supported
Subscribe today and get immediate
access to download our PowerPoint templates.