Slide 12 of 13 from Global Business Strategy PowerPoint Template
Financial Impact Overview Slide – Global Business Strategy Slide Deck
Financial Impact Slide for Business Strategy
- Chart
- Bar Horizontal
- Financial Summary Slide
- 16:9
- 100% Editable
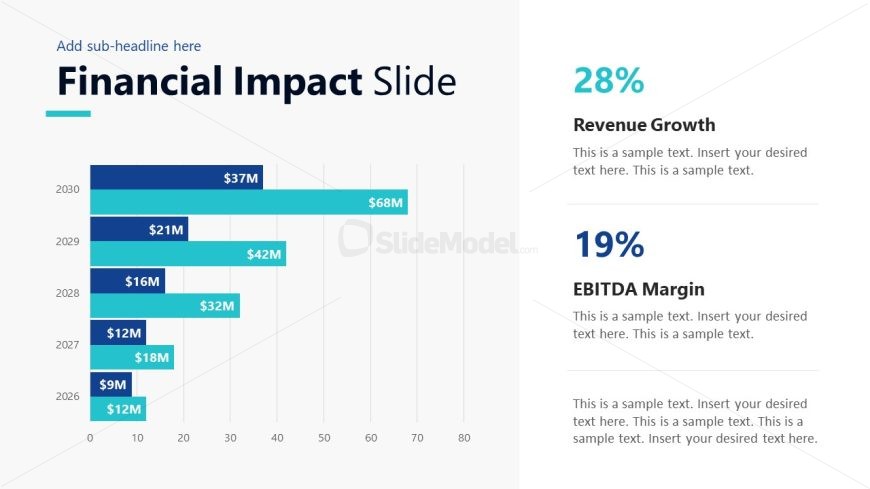
The Financial Impact Slide from the Global Business Strategy PowerPoint Template offers a clear visualization of multi-year financial data using a horizontal bar chart alongside key financial metrics. This slide layout is ideal for corporate presentations and strategic planning sessions that require precise financial summaries. Its design supports business presentation needs by integrating editable shapes and vector icons to enhance data clarity and engagement within a professional slide deck.
What’s on This Slide
The layout features a bar chart positioned on the left side, displaying financial data for multiple years. Each bar is colored in varying shades of blue and teal, with labels indicating monetary values. To the right, there are text placeholders for key metrics such as revenue growth and EBITDA margin, with the largest placeholder for the title at the top. The overall composition is balanced, with a clear visual hierarchy emphasizing the chart. Background is light, enhancing readability.
How to Use It
This layout serves to present financial metrics in a clear and structured manner, making it suitable for reports or presentations focused on financial performance. It fits well after problem-framing slides, providing a quantitative analysis of the business impact. Scenarios include quarterly financial reviews, annual reports, or strategic planning sessions where financial data is critical for decision-making.
Text Placeholders & Capacity
Keep your copy within these limits so it fits without resizing. Body slots can accommodate roughly 15-20 words each.
| Placeholder | Count | Max characters (approx.) |
|---|---|---|
| Slide title | 1 | 30 |
| Item heading | 8 | 10 |
| Item body | 8 | 10 |
| Body paragraph | 3 | 100 |
Slide Keywords
Download unlimited PowerPoint templates, charts and graphics for your presentations with our annual plan.
DOWNLOADReturn to Global Business Strategy PowerPoint Template.