Geospatial Information Value Chain PowerPoint Diagram
Geospatial Information Value Chain PowerPoint Diagram – The Geospatial Industry references the commercialization of statistical analysis over location – spatial information and the software that involves its visualization and utilization. Its uses ranges from local advertisement , leisure and travel and even to response to national disasters. This industry produces information (for instance in the form of statistics relating to the geographic distribution of Ebola or of social service centres), products (for example GPS receivers and phones) and services (for instance storm or earthquake tracking).
While the consumer products are broadly user-friendly – many requiring only an address to be inputted – the professional applications require significant and continued technical training. This has precipitated a growth in the geospatial analysis market as people seek to provide an approach to applying statistical analysis and other informational techniques to data which has a geographical or geospatial aspect.
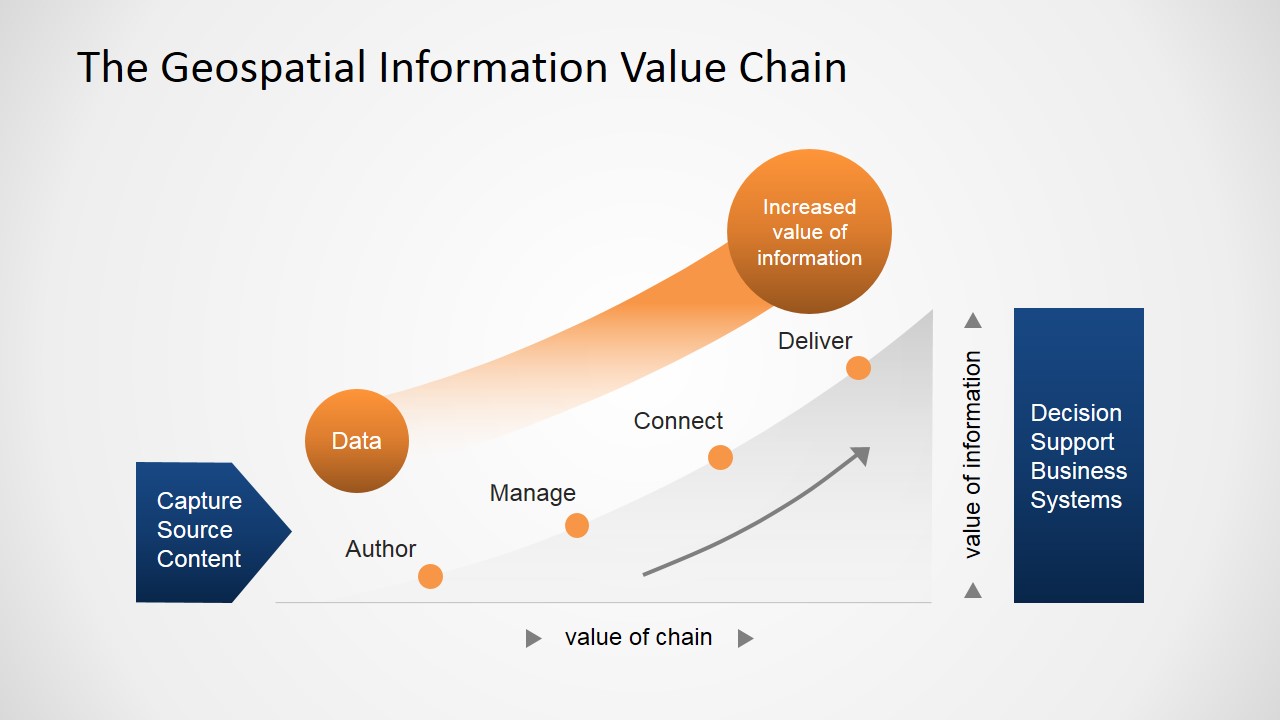
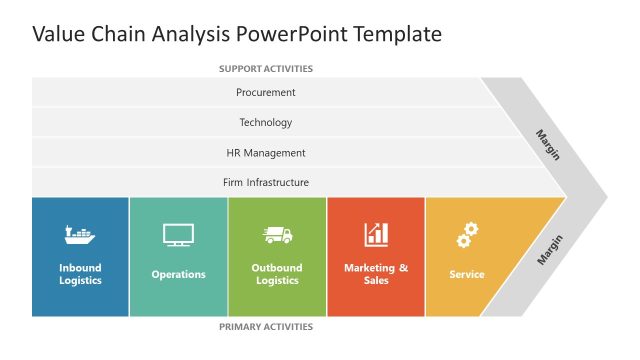
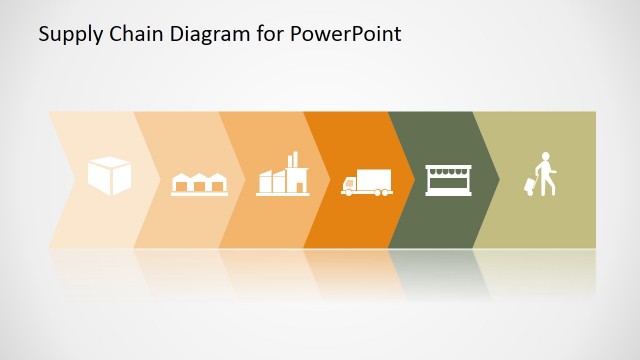
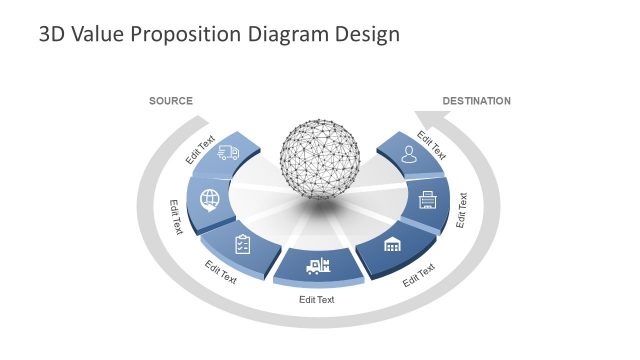
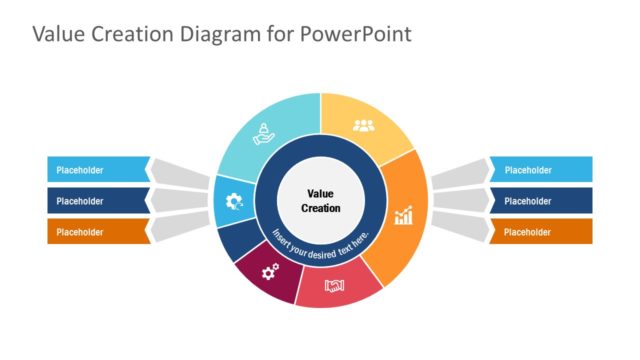
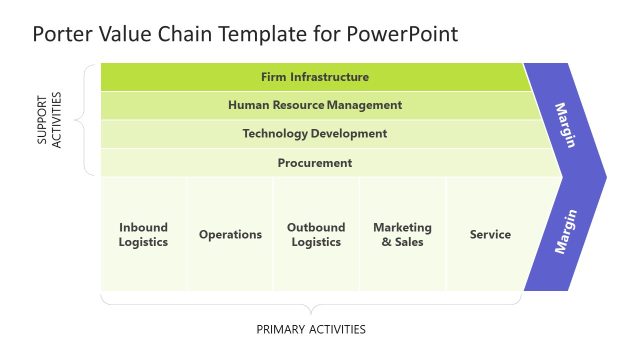
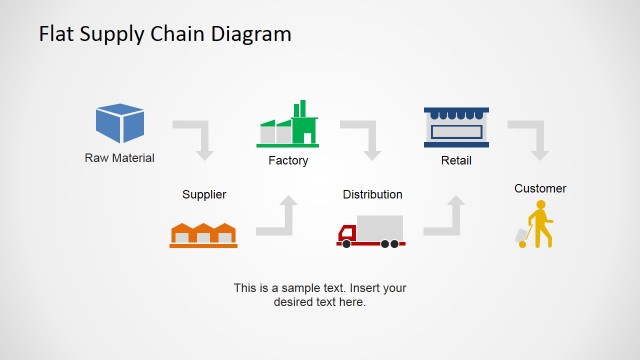
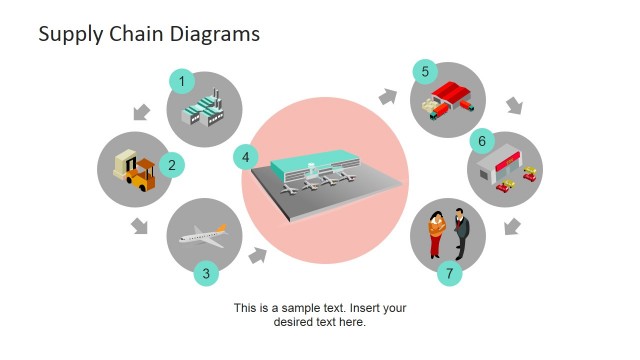
The Geospatial Information Value Chain PowerPoint Diagram provides a professional designed visual aid that offers capabilities with which to capture, store, manipulate, analyze, manage, and present all types of geographical data, and utilise geospatial analysis in the form of a conventional value chain. Using a value chain, lecture and seminar presenters can present (as a chain) a list of activities that a firm or business is operating within a specific industry in order to deliver a valuable product or service for the market. The idea being to present a process view of the organisation as a system made up of subsystems each with inputs, transformation processes and outputs.
This PowerPoint template diagram is entirely editable. All of the icons on display here are formed of high quality clip art vector images that have been sourced from the vast banks freely available in all PowerPoint applications.
