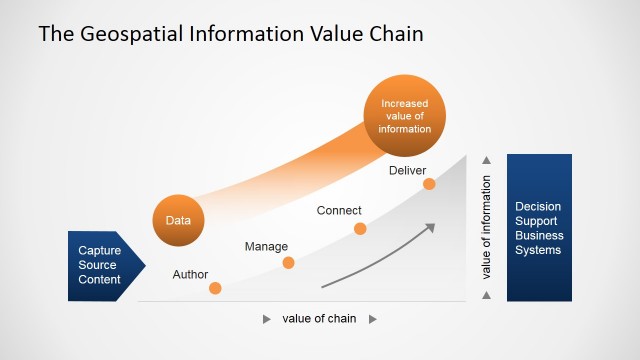
Value Chain for Geospatial Analysis
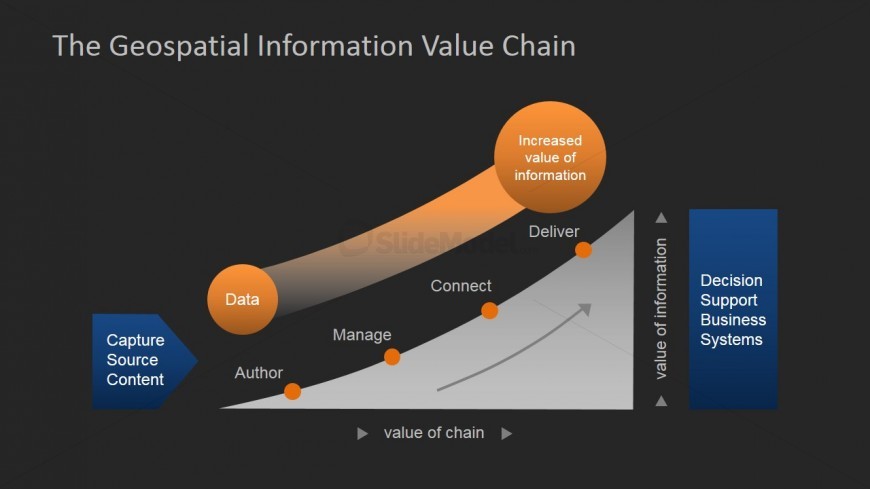
The slide design features a Value Chain for Geospatial Analysis. It can be used in business presentations to provide a visual representation of the increasing value of information for different entities. The presenter can edit the position or arrangement of the PowerPoint icons. Any modification will not affect the image resolution of the design.
At the center of the slide is a graph, with a curved highlighted area that resembles a ramp. Along the curve are four orange circles to represent certain elements. Two circles are located at the top of both ends of the graph. These circles are labeled “data” and “increased value of information.”
Return to Geospatial Information Value Chain PowerPoint Diagram.