Funnel Input Output Transformation Diagram PowerPoint Template
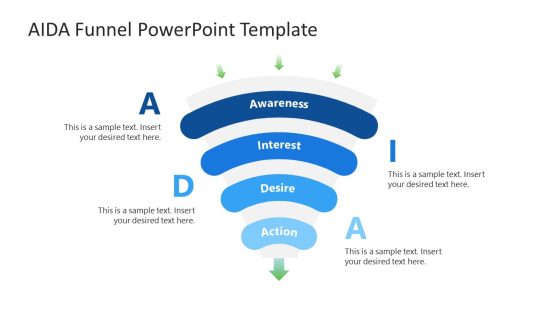
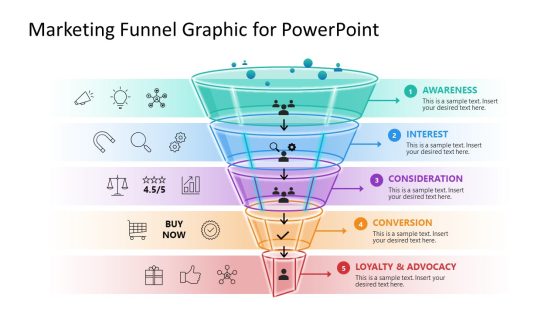
Visualize process flows and converging ideas using our editable Funnel Input Output Transformation Diagram PowerPoint Template in your strategy presentations. The funnel diagram with input and output points helps users showcase how multiple inputs combine to give a solid output. They can easily present a transformation process using this funnel diagram. In internal review meetings, operations managers use the funnel diagram to show how multiple process streams flow into a single production output. Strategy directors present how different experts or teams contribute to the success of a new initiative. A supply chain manager uses the labeled input-output diagram to showcase how vendor sourcing, logistics, and quality control create procurement consolidation.
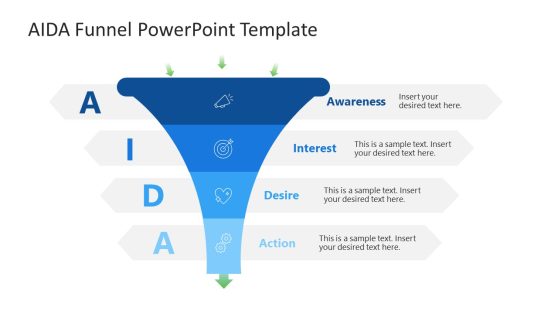
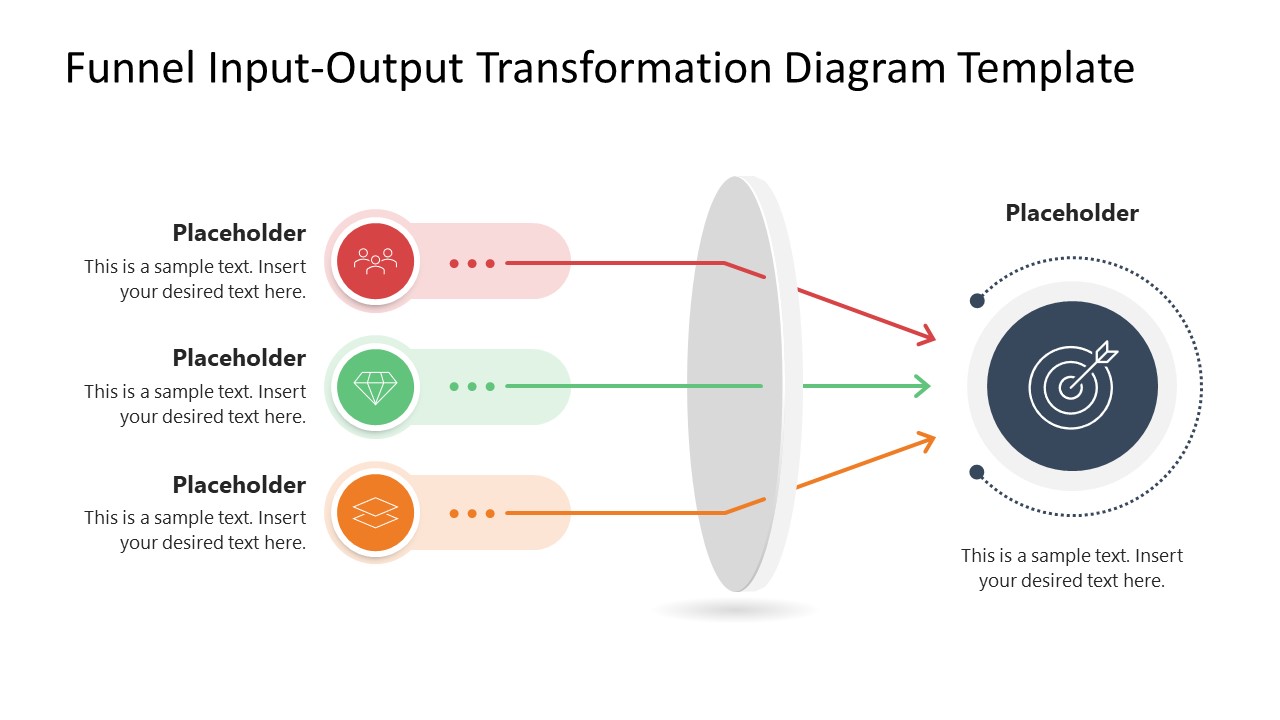
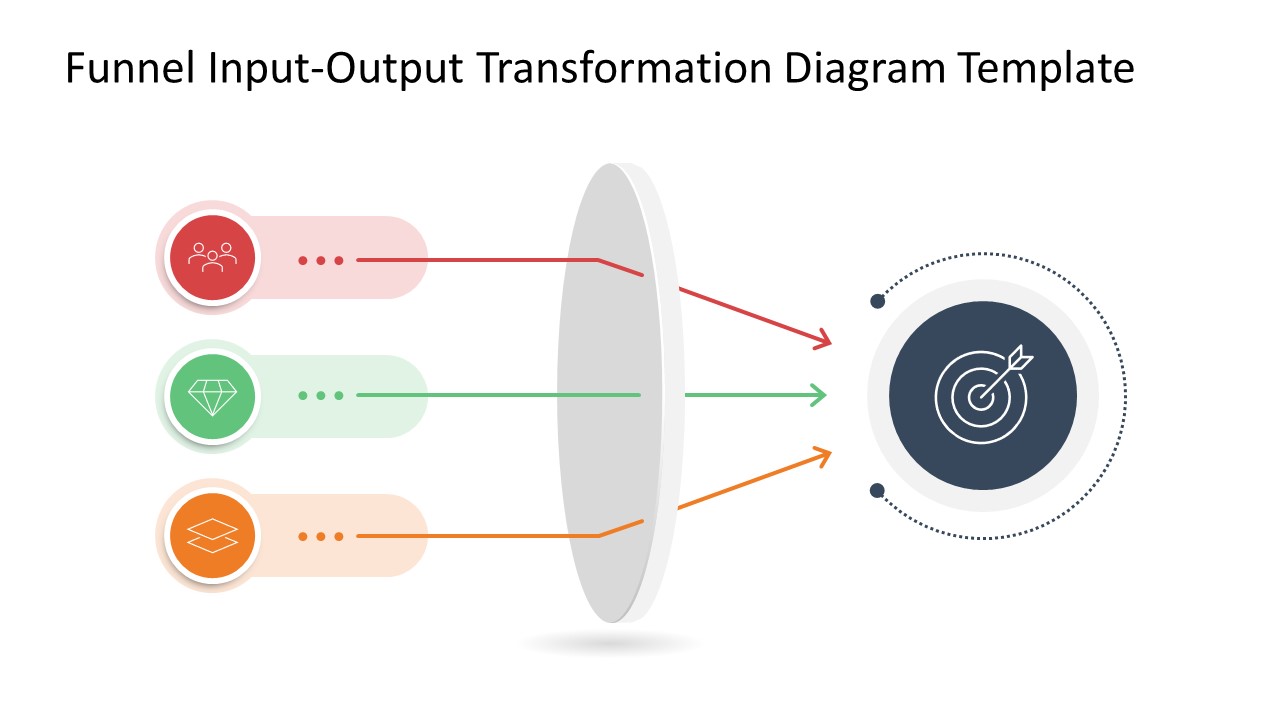
The Funnel Input Output Transformation Diagram PowerPoint Template uses a horizontal funnel diagram with three color-coded input rows. Each has a small text block, an infographic icon, and a line arrow entering into the convex shape. After passing through the convex figure, the directional arrows converge into a single circular shape, indicating the target. Users can easily adjust the color codes used in the diagram to distinctly highlight each input. Business strategy leaders can change the number of input rows based on their data points and edit the text segments to showcase the details. The first slide shows relevant text sections for each point, while the second slide allows presenters to use only the infographic to visually demonstrate the concept. The use of shadows gives the presentation a 3D appearance, engaging the audience.
All the elements used in the diagram are editable. You can also visit our collection of funnel templates to try other versions for your business presentations. Download the funnel input-output transformation diagram PPT template for your marketing presentations and present customer journey steps effectively.
You must have an active subscription to download this file.
- Category
- Diagrams
- Rating
-

 Loading...
 - Size
- 16x9
- Item ID
- 23694-01
- Colors
Subscribe today and get immediate
access to download our PowerPoint templates.