Taiwan Professional Dashboard for PowerPoint
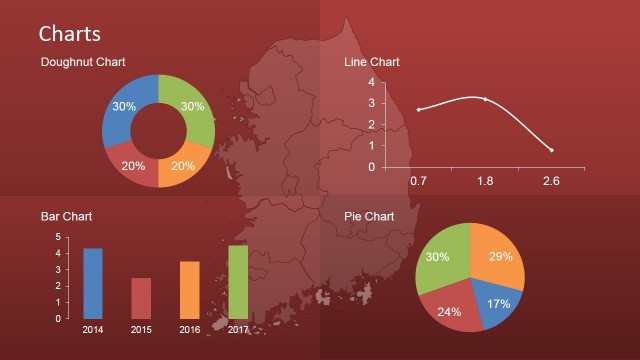
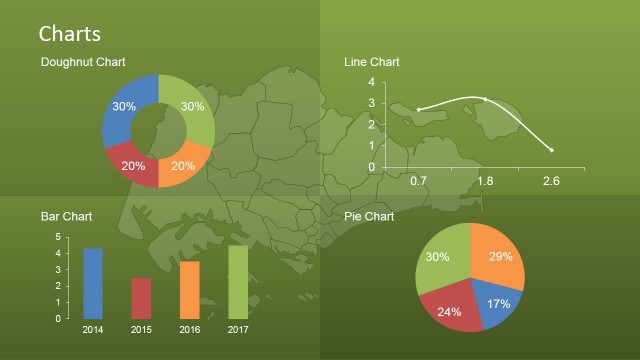
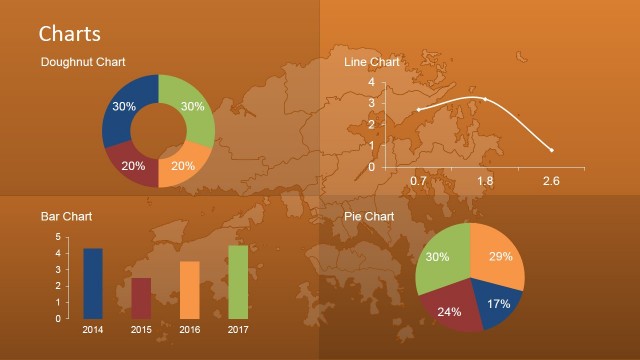
The Taiwan Professional Dashboard for PowerPoint is useful for illustrating statistical information about the country of Taiwan. Using the colorful PowerPoint graphics, the presenter can show data like population, religion, economic growth, and national demographic.
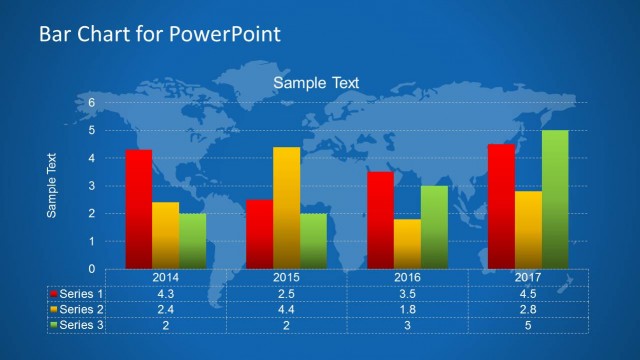
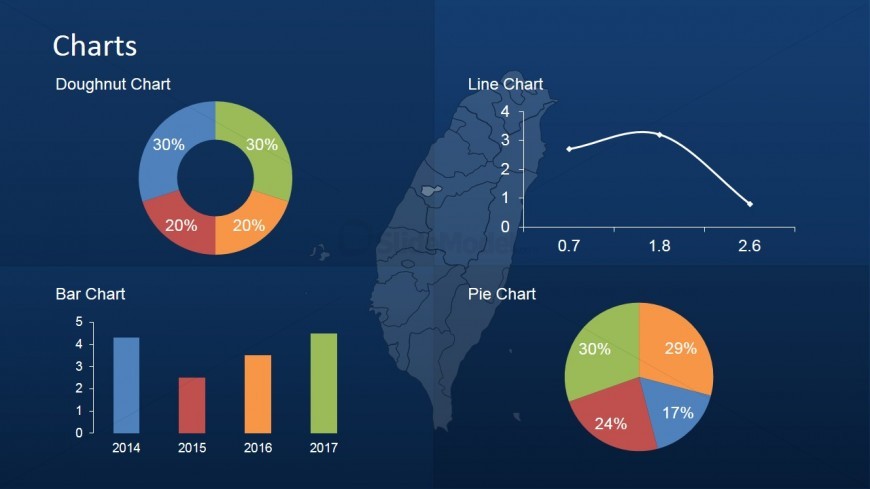
There are four charts on the slide – doughnut chart, line chart, bar chart, and pie chart. These are found in a default blue, red, green, and yellow color scheme. The presentation background features a watermark of a map of Taiwan, highlighted in blue. The presenter can edit the position or arrangement of the PowerPoint icons. Any modification will not affect the image resolution of the design.
Return to Four Asian Tigers PowerPoint Template.