Flow Model PowerPoint Template
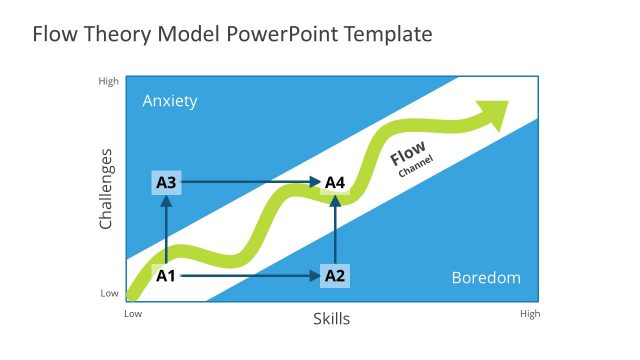
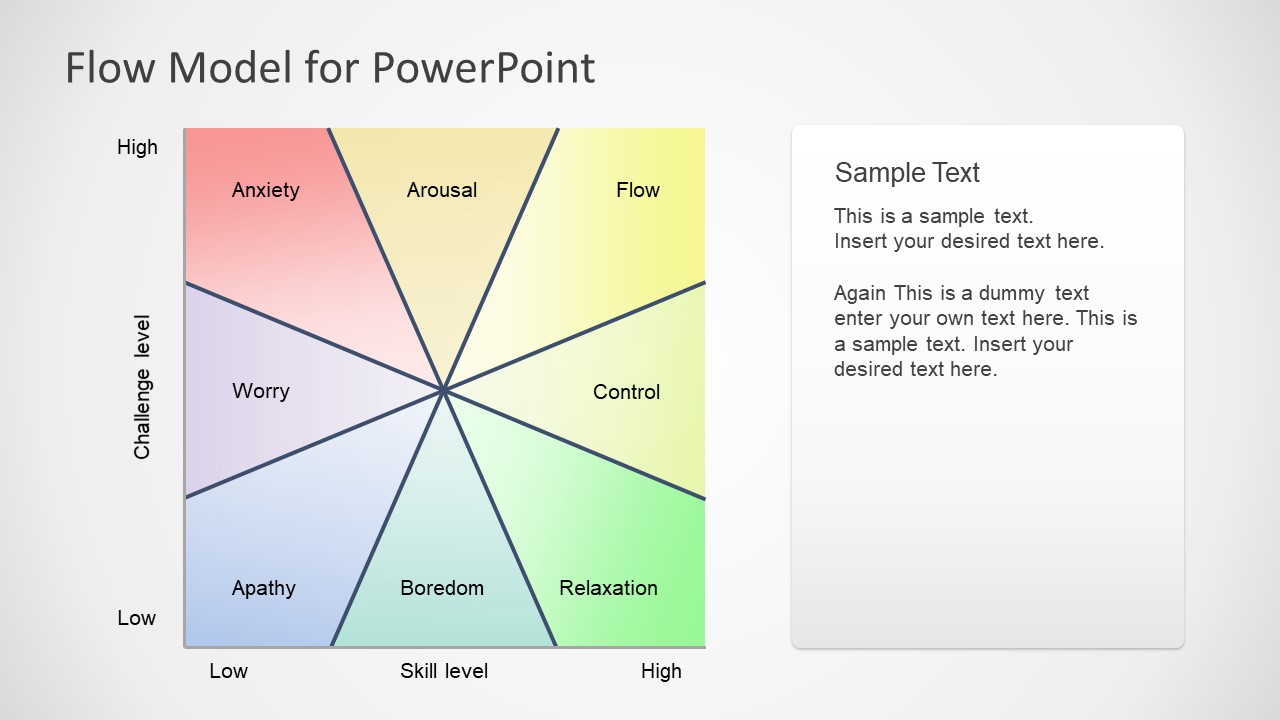
The Flow Model PowerPoint Template is a concept diagram design for balance between skills and challenges. This template provides a circular flow model on chart to analyze skill level and challenges of the activity. The Skills vs. Challenges flow model is optimal experience psychology defined by Mihaly Csikszentmihalyi. The model displays various emotions that individuals would likely experience during a task. These emotions are based on the difficulty of challenge and skill level of workforce. Therefore, the flow chart model could be used to describe experience and expertise required for various project activities. Similarly, the diagram of flow model can assist professionals to map experience and define future careers.
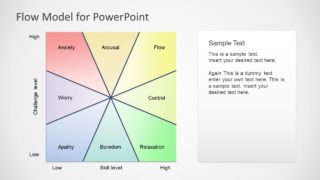
The diagram template of skills vs. challenge PowerPoint is an editable layout of Mihaly Csikszentmihalyi’s flow chart. It displays 8 behaviors as a result of skill and challenge levels. The template us different gradient colors to display levels of emotion outcomes. These emotions include apathy, boredom, relaxation, control, flow, arousal, anxiety, and worry. For example, if a task on hand doesn’t require extensive skills and it is not challenging either, it will be at apathy. Whereas, if a task requires highly skillful workforce or it is challenging, the user may feel relaxation or anxiety.
The Flow Model PowerPoint Template will enable professionals to identify goals, balance, and feedback through diagram. It further helps professionals to analyze and improve their skill levels. For instance, individuals can first develop strategies to improve concentration and build self-confidence. Next, take feedback into account and focus on problematic areas for more challenging work.
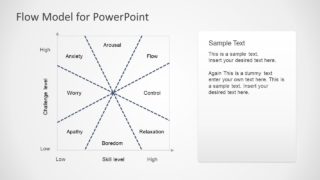
The template of flow model provides two slide designs to present skills and challenges in any work environment. The users can copy desired slide into pre-existing business or learning presentation. Because the user of graphics and concept diagrams could help deliver ideas more effectively.

You must be logged in to download this file.
DOWNLOAD- Category
- Models
- Rating

 Loading...
- Size
- 16x9
- Item ID
- 6984-01
- Colors
Subscribe today and get immediate
access to download our PowerPoint templates.