Flat Sales Dashboard PowerPoint Templates
Flat Sales Dashboard PowerPoint Templates – In a knowledge economies, visualization has emerged as a modern business language. Charts, graphs, maps, diagrams, infographics and dashboard are applied to transcend text in order to help executives better understand their business.
Data visualizations (a.k.a DataViz ) has become imperative for competitive companies. Managers succeed when they are able to think their business visually. Business decisions need to be transmitted through simple and accessible messages, better modeled through visualizations.
Dashboards are considered as a set of visualizations that summarize important data, trends and KPI’s. The Dashboard visual structure enable managers to locate in the same panel important informations that is related, in order to compare and transmit quickly.
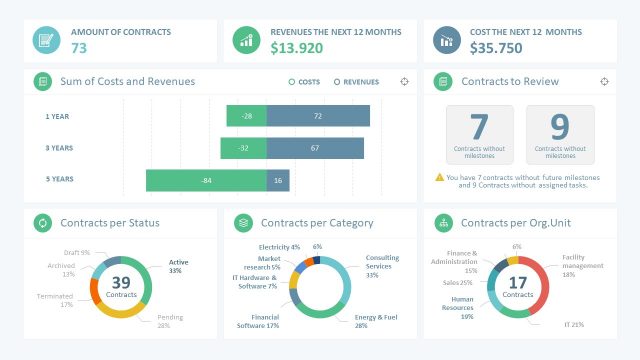
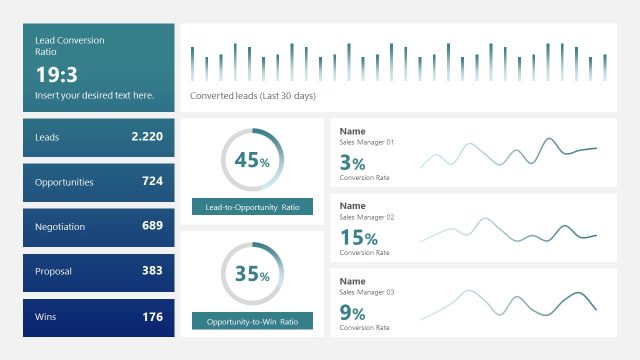
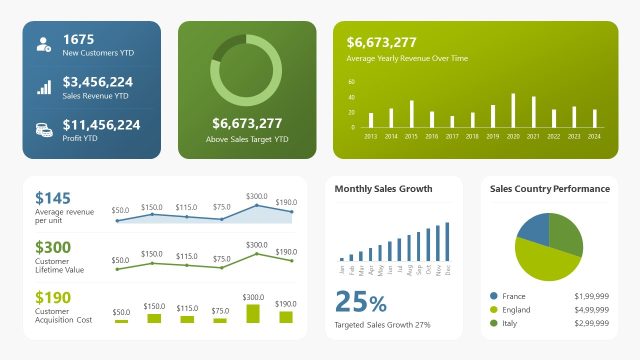
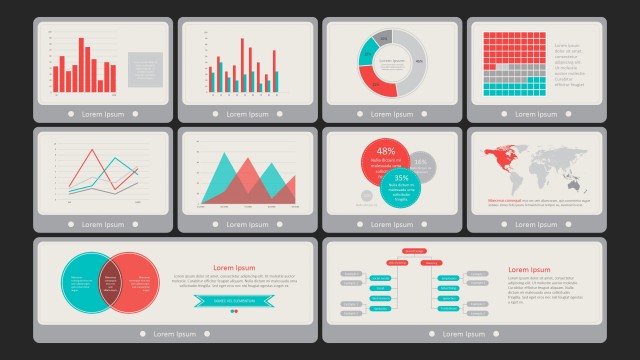
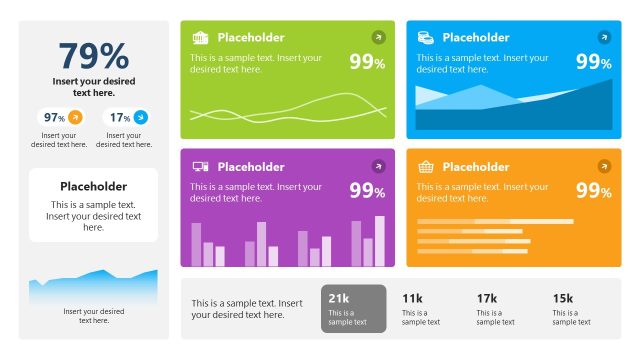
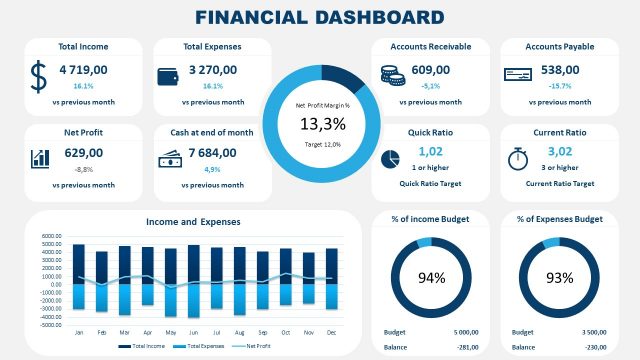
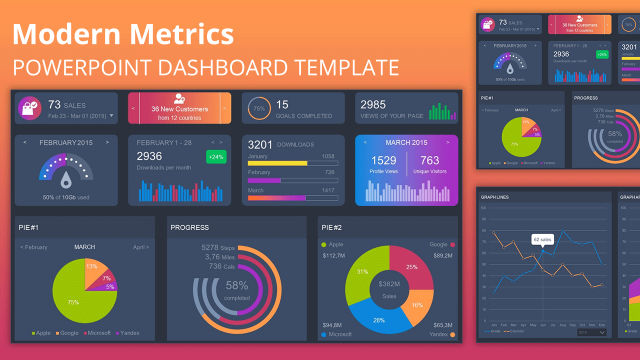
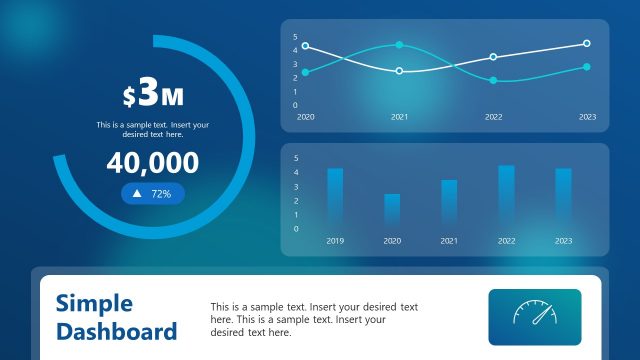
The Flat Sales Dashboard PowerPoint templates provides eight (8) slides with editable charts and visualizations for managers to present their sales results. The PowerPoint Dashboard is structured with the following panels:
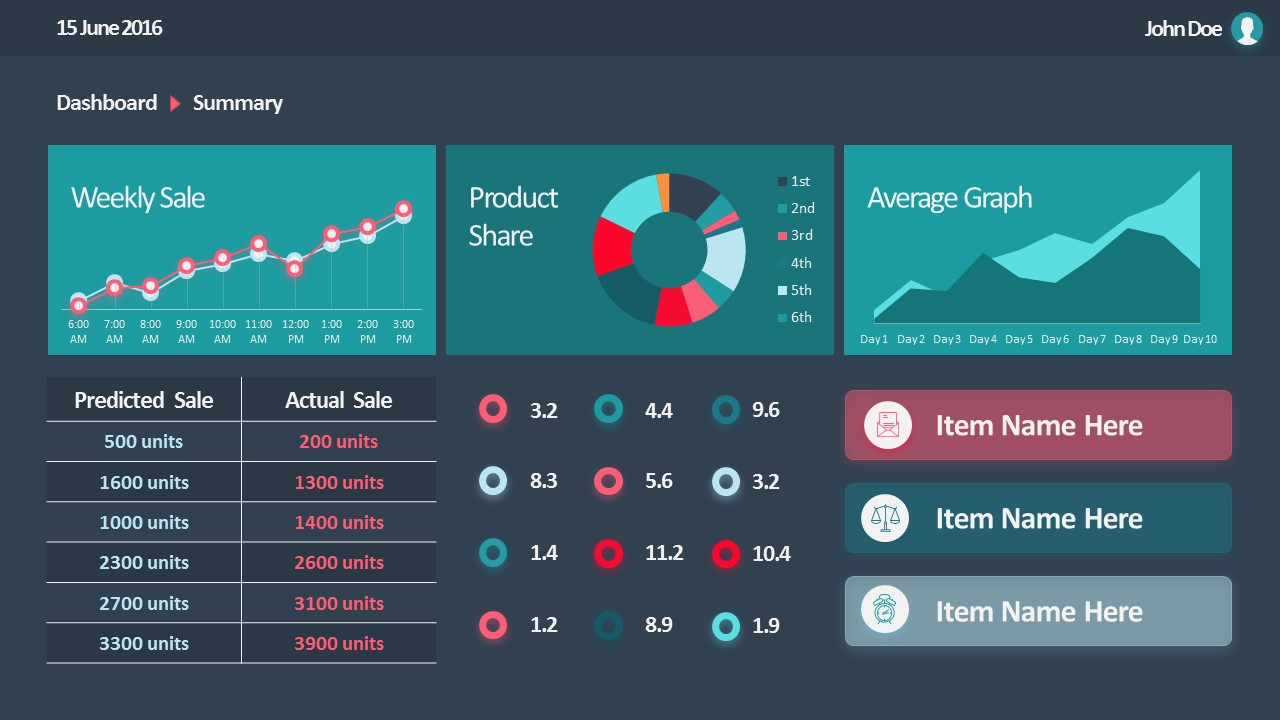
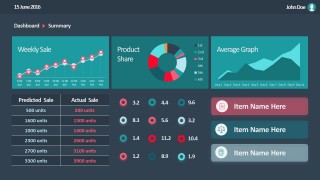
- Summary Panel: PowerPoint Dashboard containing editable data driven charts for weekly sales, Product Share and Average Sales through area chart. It provides a table with the forecast vs actual sales and a sales heatmap.
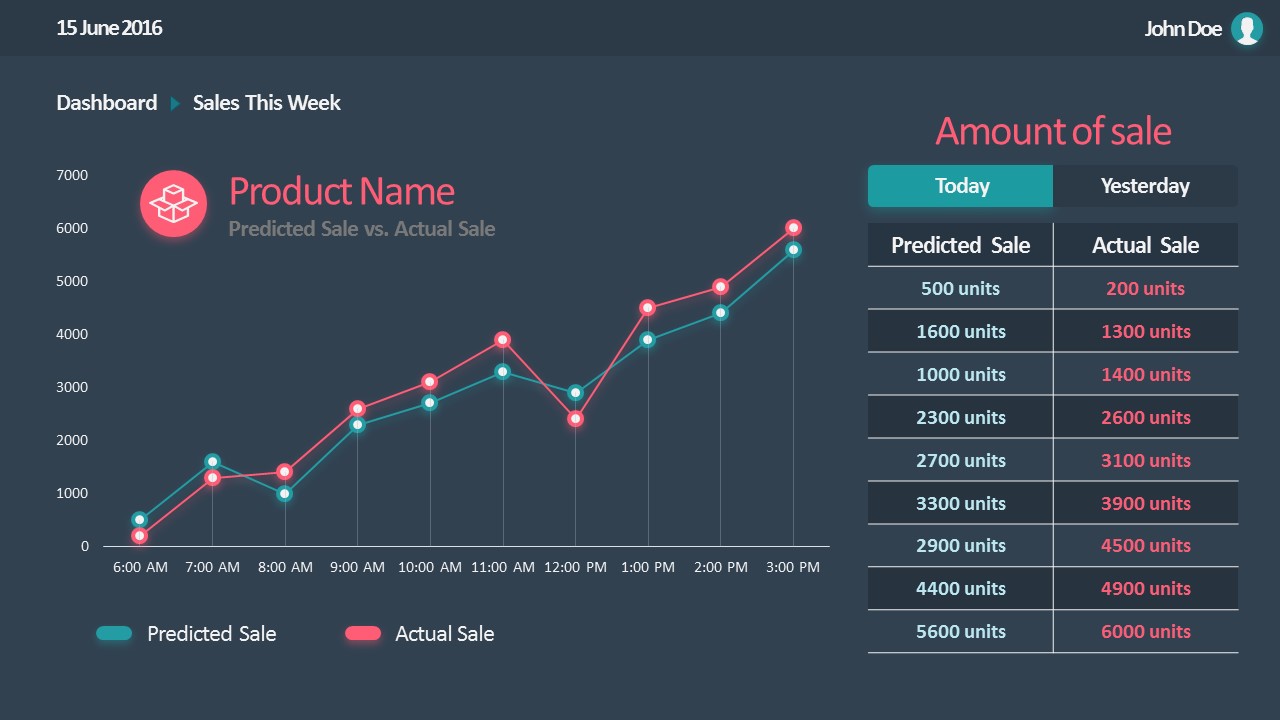
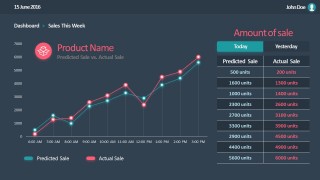
- Weekly Sales: Data Driven Line chart expressing the weekly sales, forecast vs actual metrics
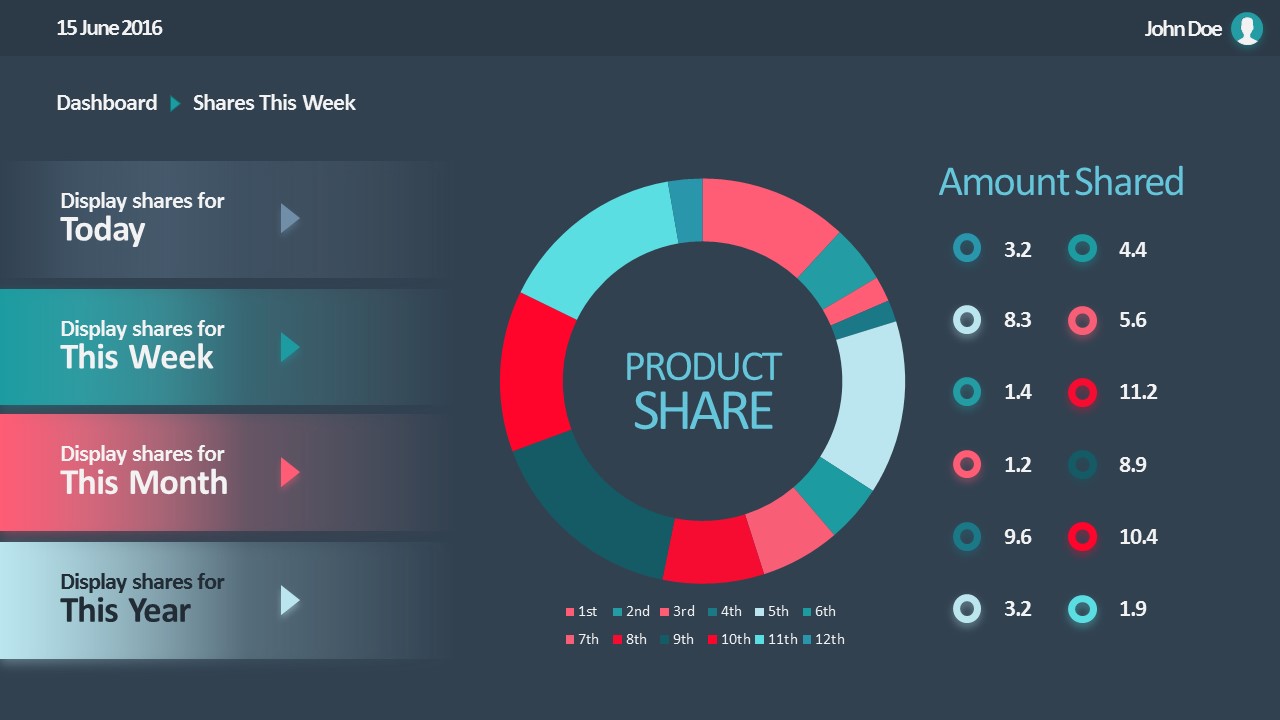
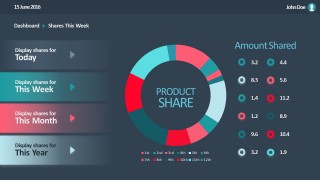
- Product Share: Sales data driven Donut Chart expressing Product Share by product category.
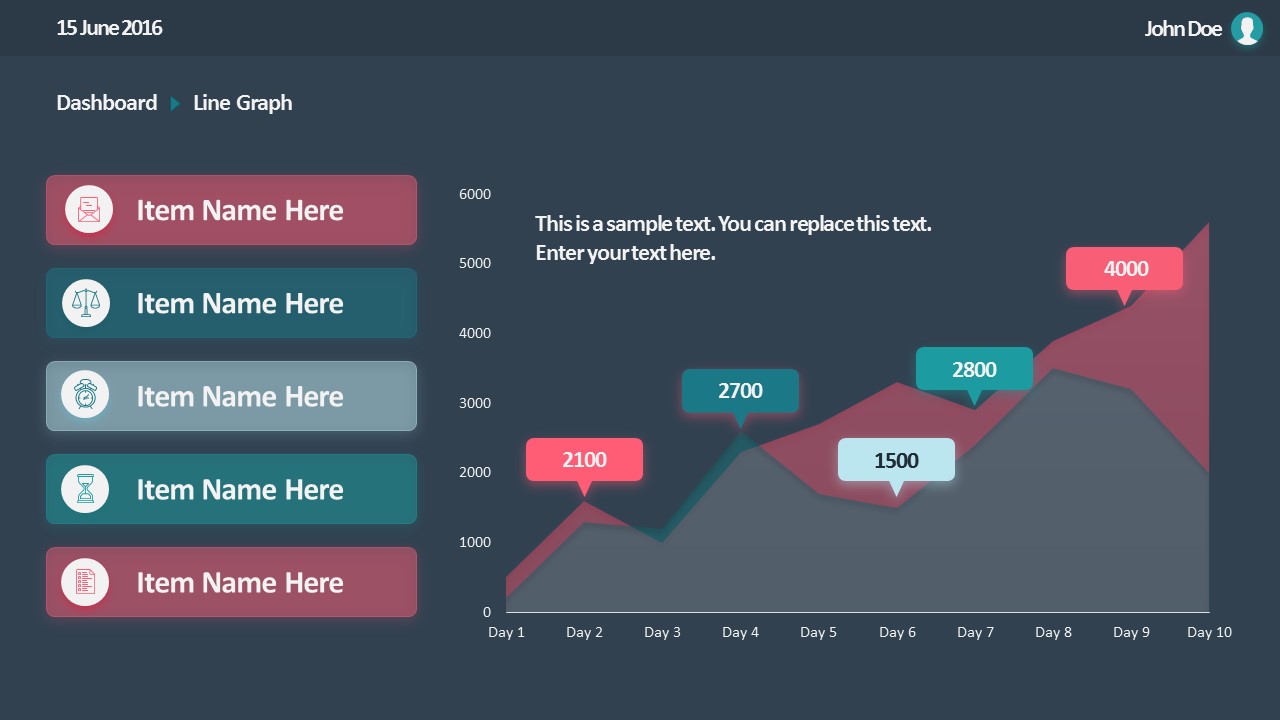
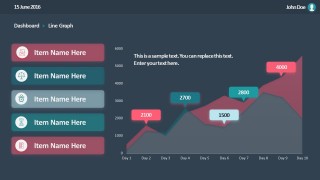
- Data Driven Area Chart for Product Cumulative Sales.
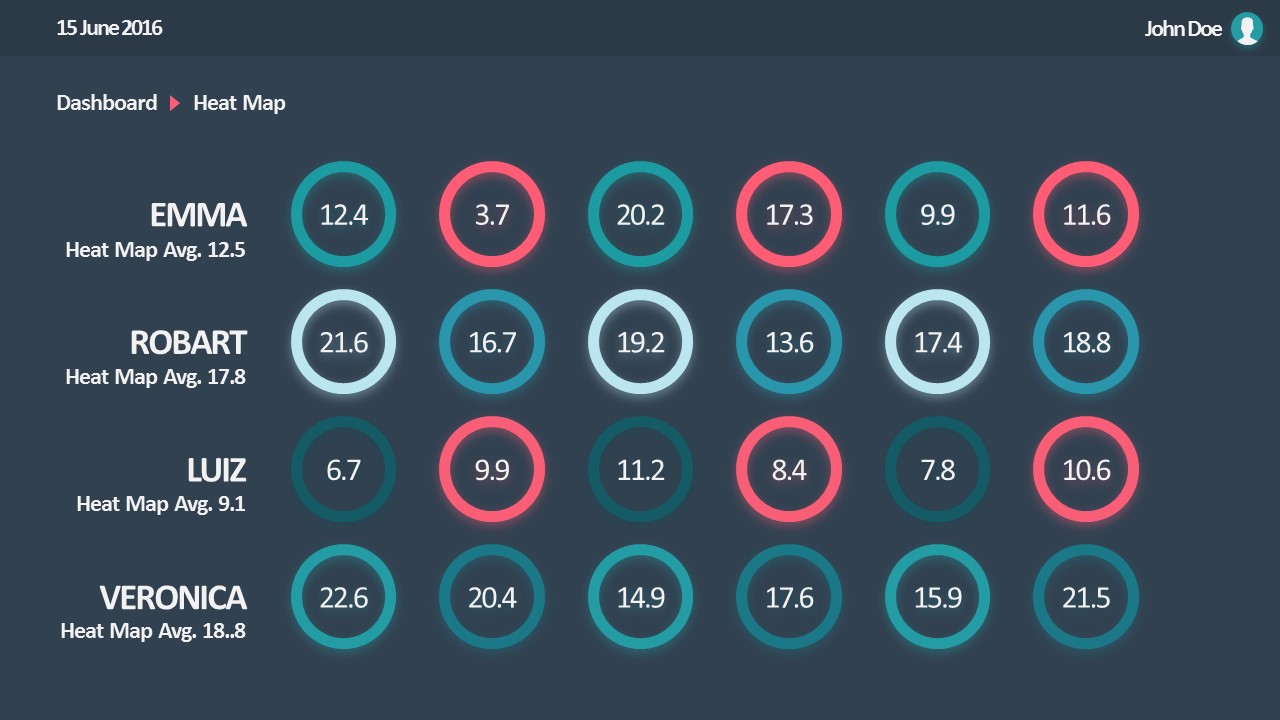
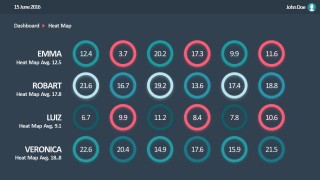
- Heat Map: Created based on individual ring shapes, the user can edit each shape and define the heatmap pattern.
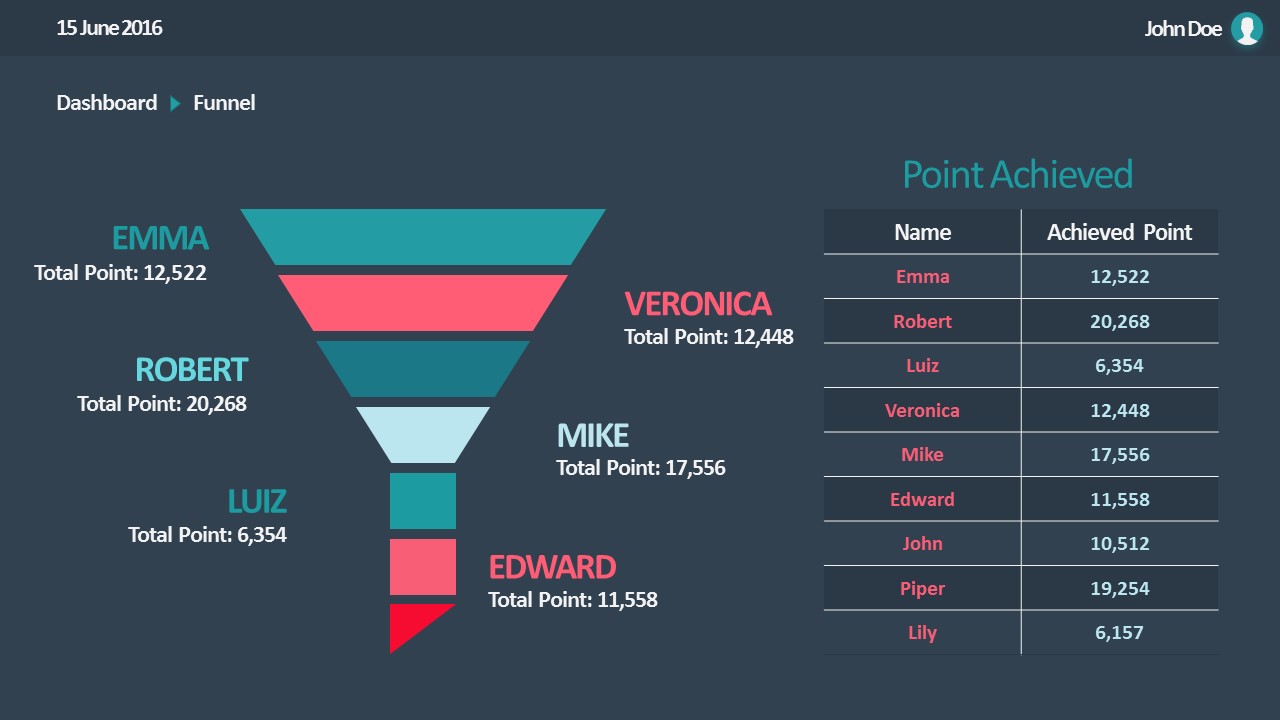
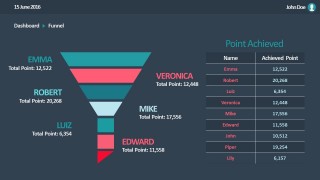
- Sales Funnel Panel: Sales Funnel Averages by Sales Representative. Ideal for capturing the best sales representatives.
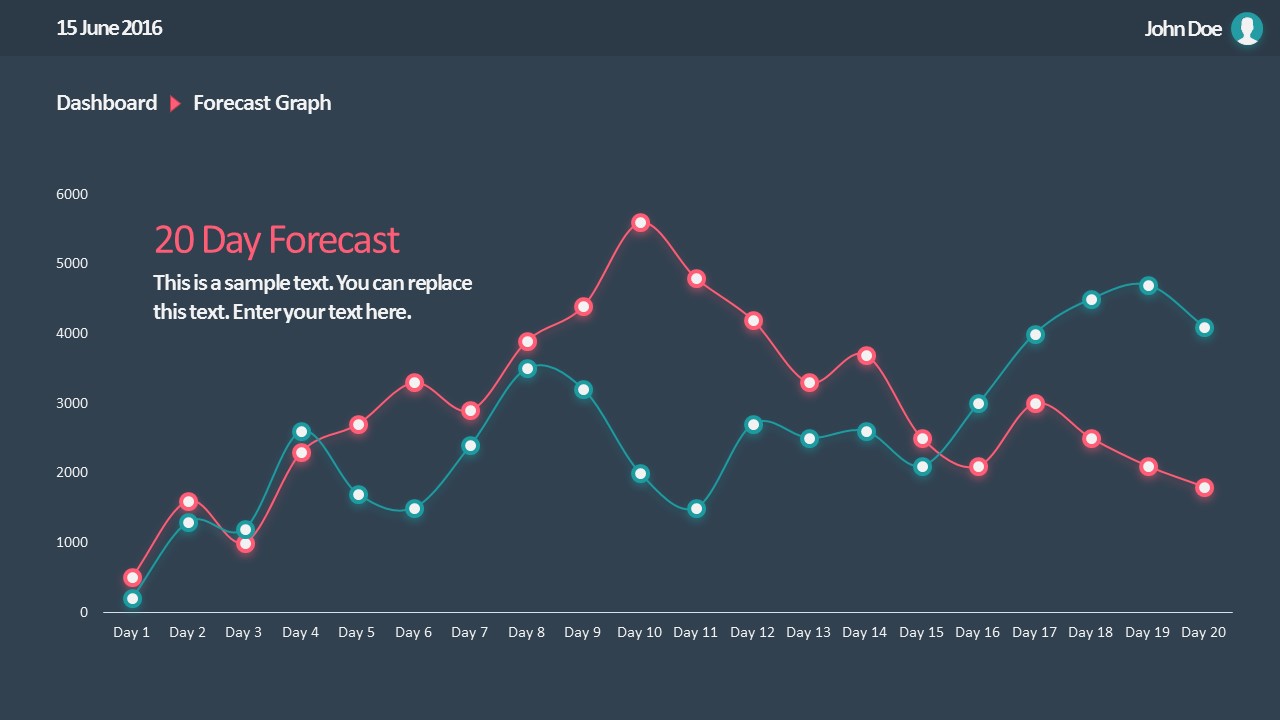
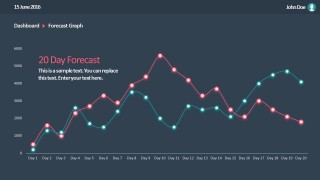
- 20 Day Forecast: Data Driven Line chart. Forecast vs Actual.
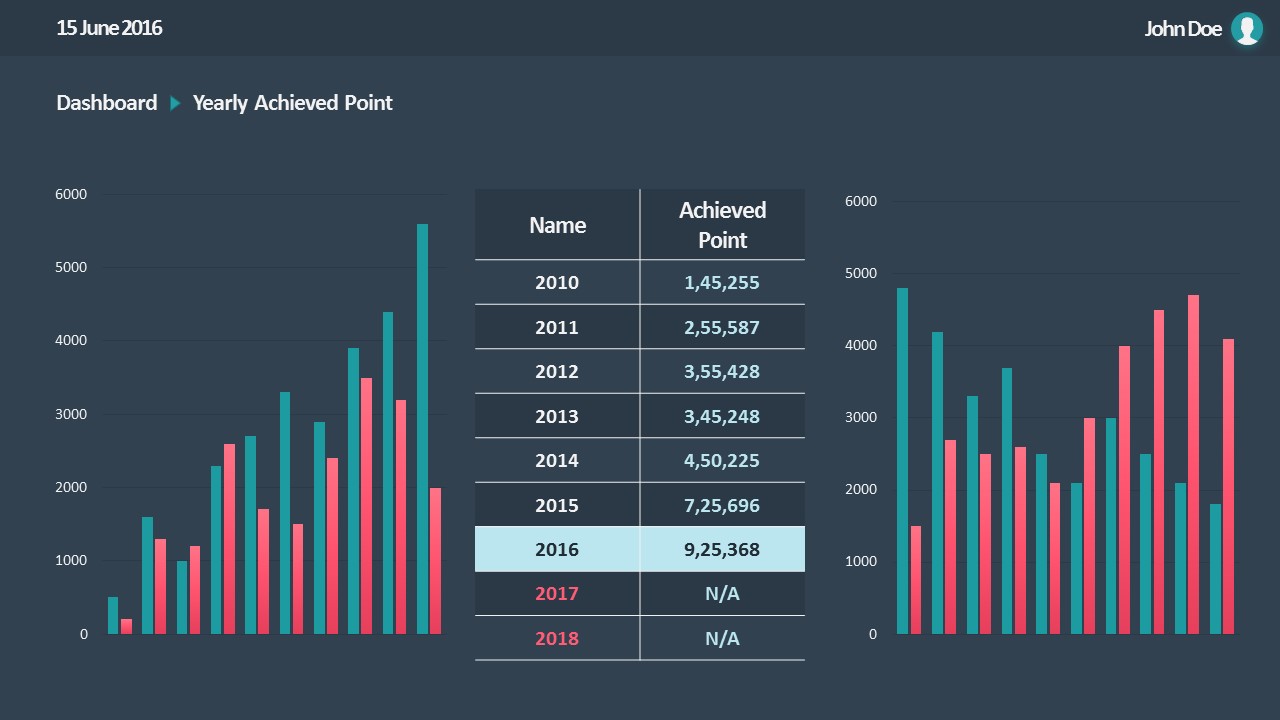
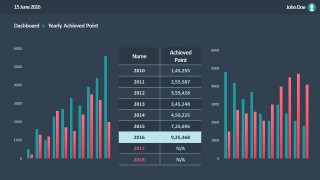
- YoY Metrics of sales: Column Chart and Tables to review YoY sales.
For Sales Managers or Marketing Managers the Flat Sales Dashboard PowerPoint Templates is a practical tool for creating weekly review meetings decks for the board. For more information check our articles about how to make a presentation graph, data presentations and chart vs. graph.
