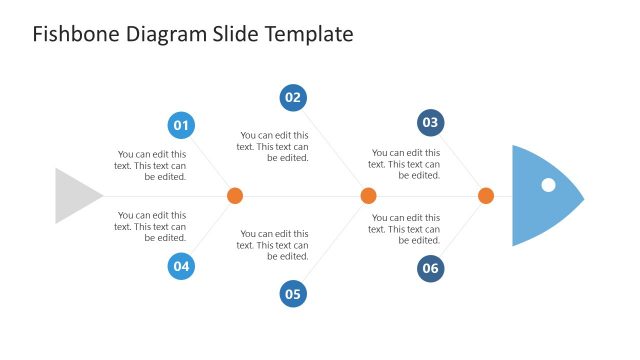
Flat Fishbone Diagram for PowerPoint
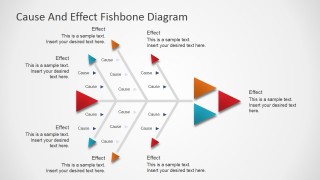
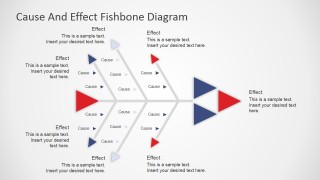
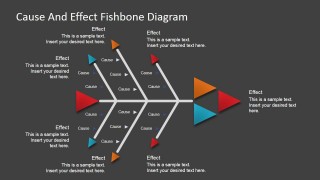
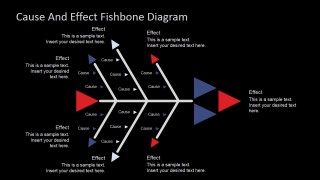
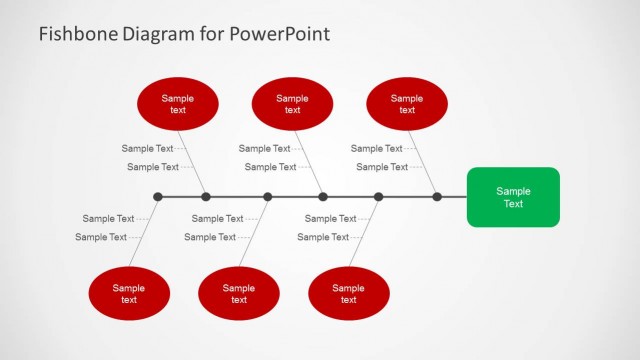
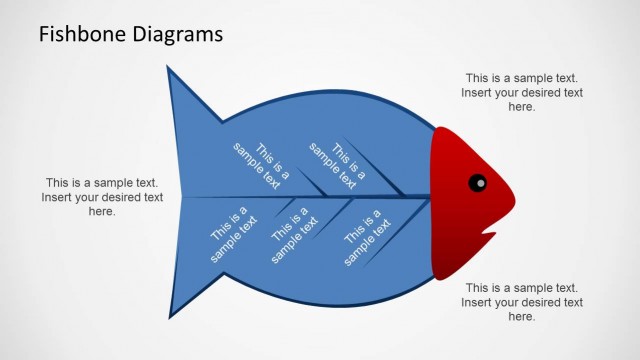
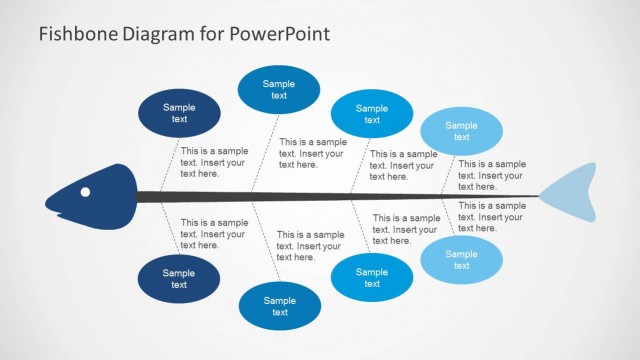
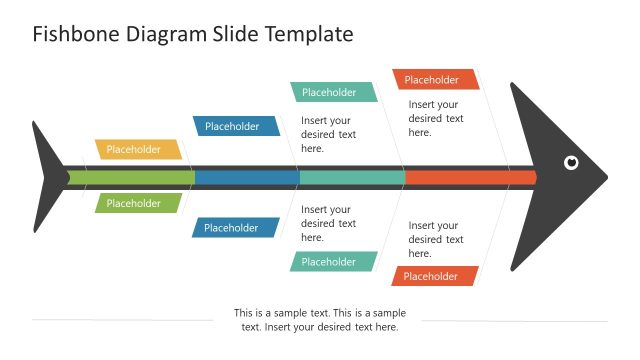
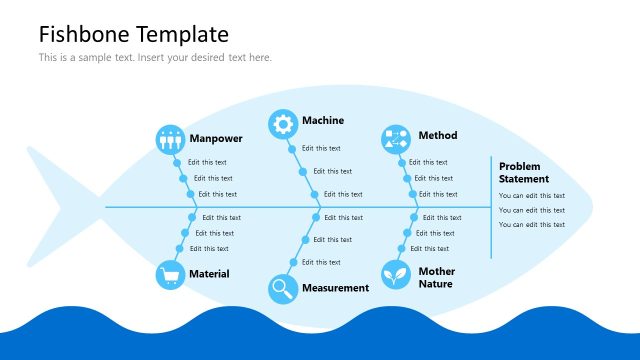
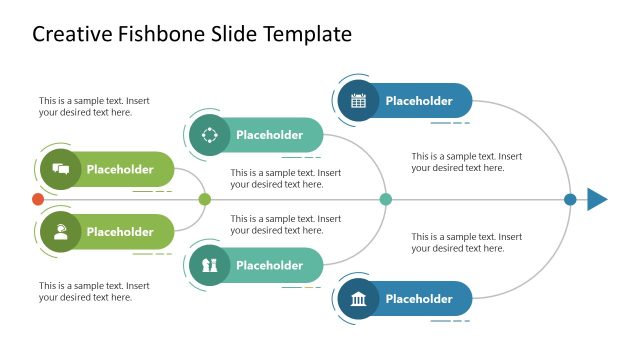
Create professional presentations featuring Root Cause Analysis (RCA) with the Flat Fishbone Diagram for PowerPoint. The fishbone design is created with simple flat PowerPoint Shapes. The user can customize the diagram look and feel and adapt it to any PowerPoint Theme.
The Fishbone diagram, also known as Cause and Effect Diagram or Ishikawa Diagram is a simple representation from the family of causal diagrams, used to identify many different causes for an effect (or issue). They are generally used in post mortem activities in order to understand which where the factors that triggered an effect, the fishbone diagram is easy to create but rather difficult to present summarized. The users need to be precise and concise in order to let the diagram speak for itself.
The fishbone diagram process can be applied directly in the presentation template. Working with Microsoft PowerPoint online, users can even collaborate together in real time in the creation of the fishbone diagram.
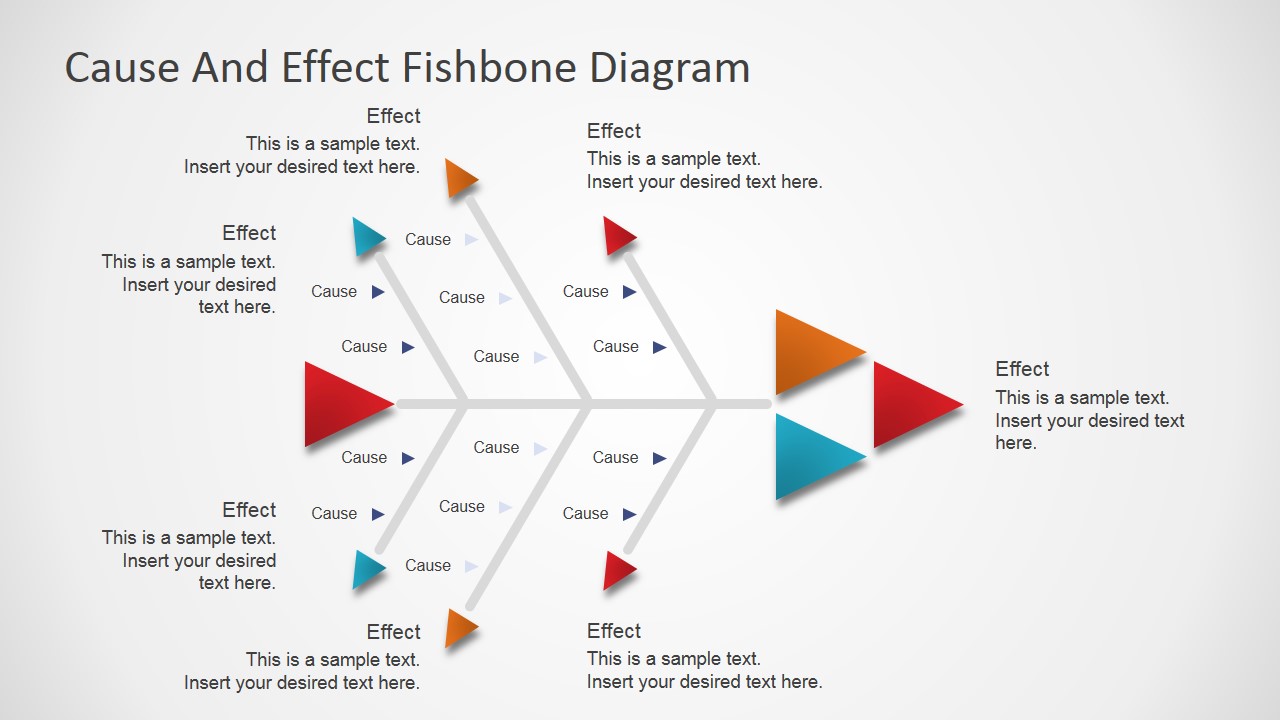
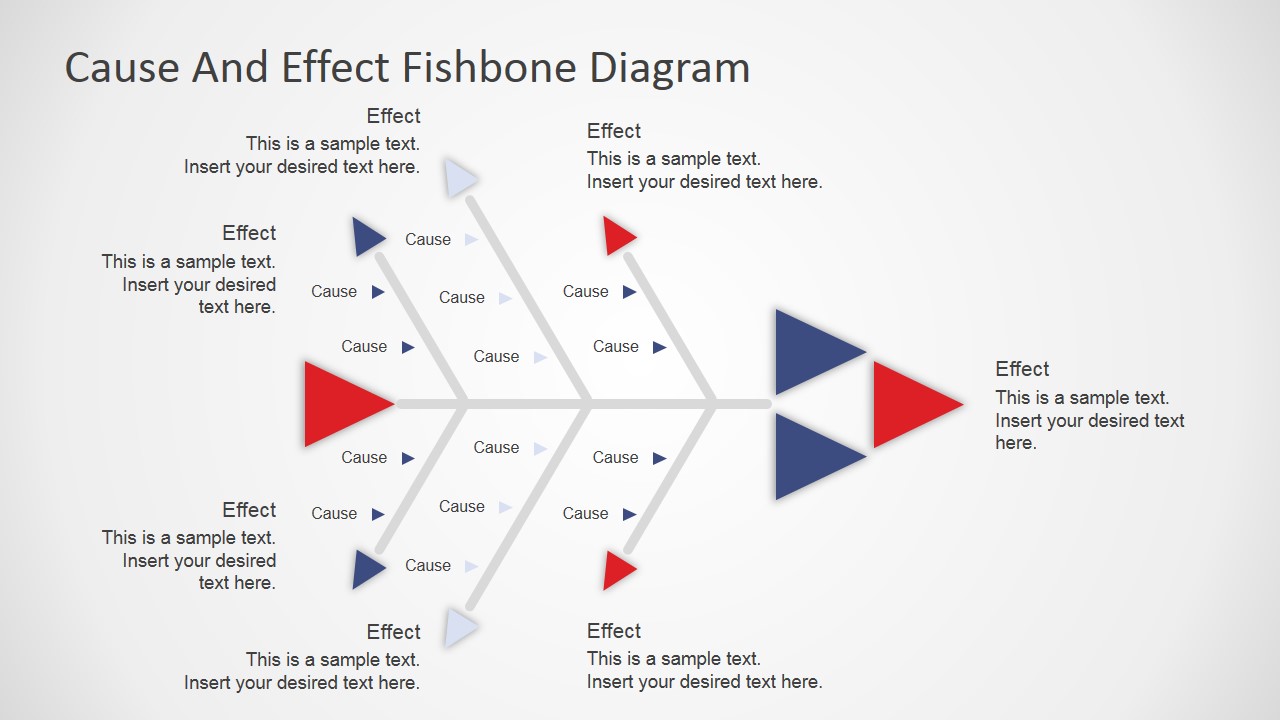
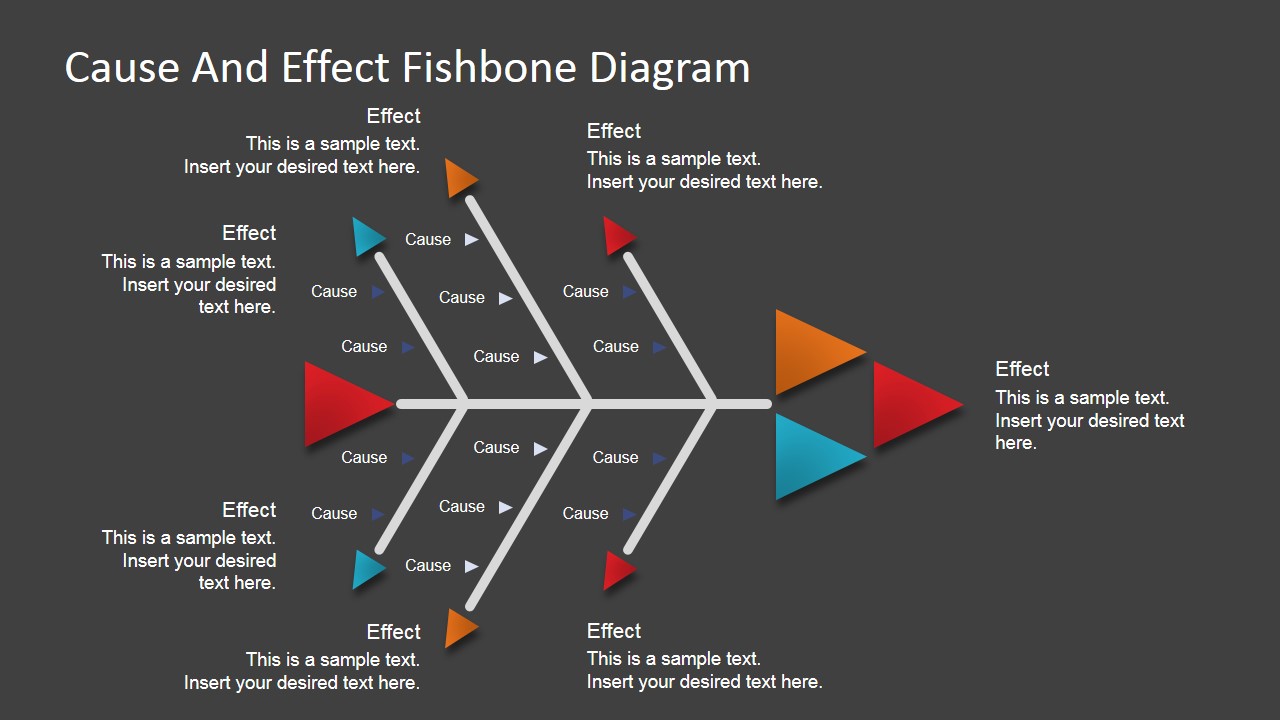
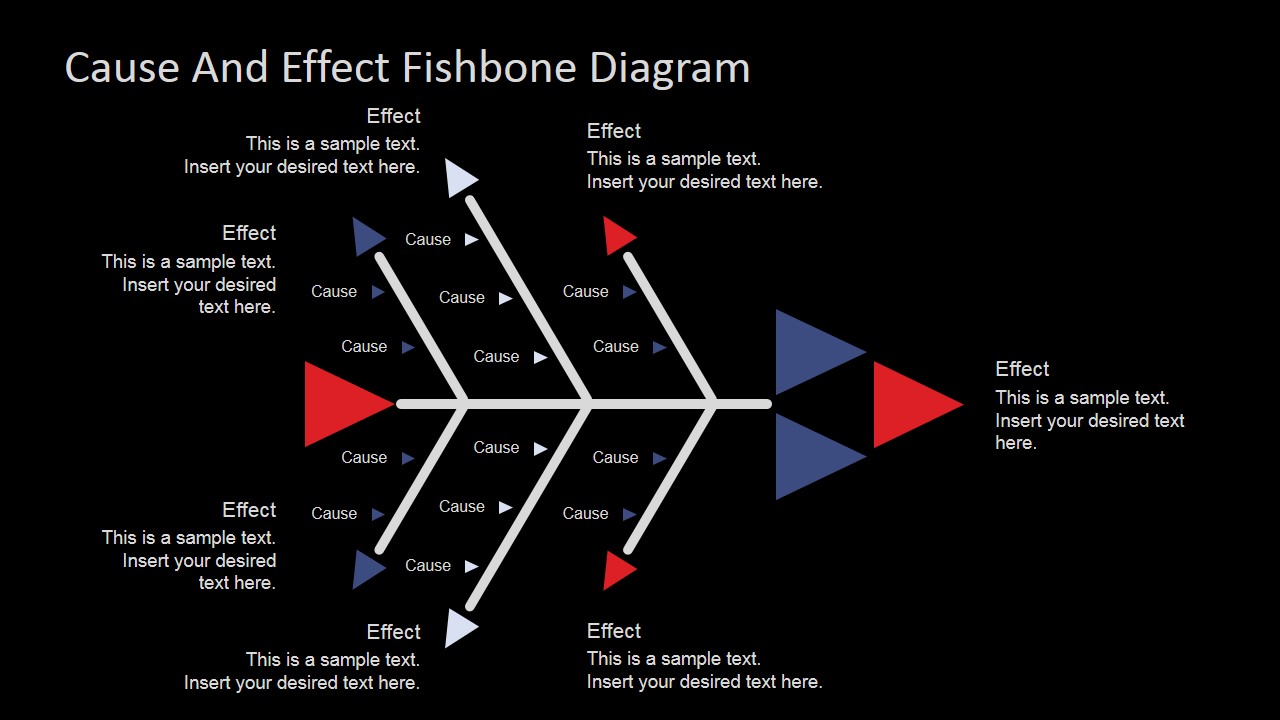
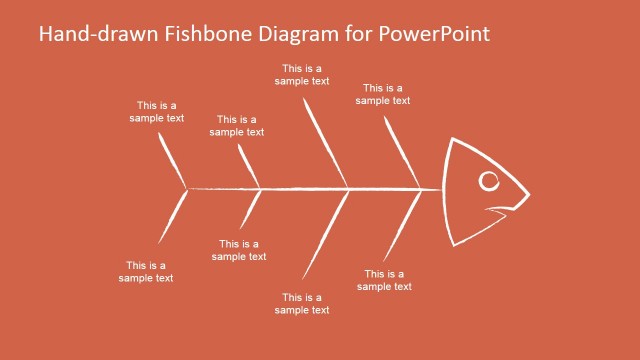
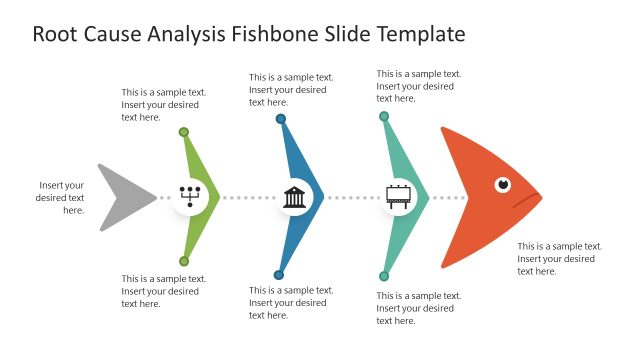
The structure of the Fishbone Diagram Template consists of the following major elements:
- The Effect: The head of the fish. Which is the effect under analysis. Users generally highlight the text associated to the fish heads in order to make it relevant.
- The Spine: The spine is the connecter between causes categories.
- The Branches: Each branch represents a set of causes, representing a category. All causes in a branch should be related.
- The Cause: Each root cause factor identified should be placed in the diagram as a leaf of a branch.
The exercise of populating the diagrams helps the users to brainstorm the different causes and their probability of incidence in the effect.
Impress your audience with simple modern designs that appeal to executive audiences.
