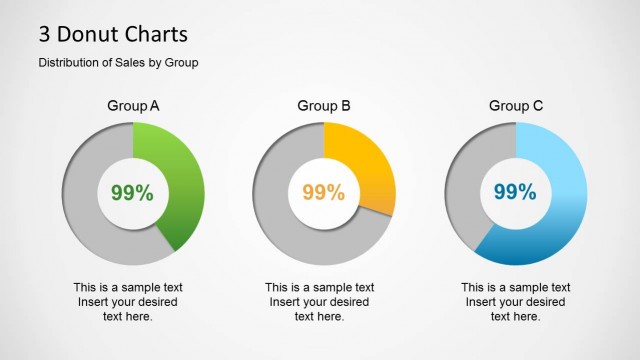
Flat Business Doughnut Chart Slide Design
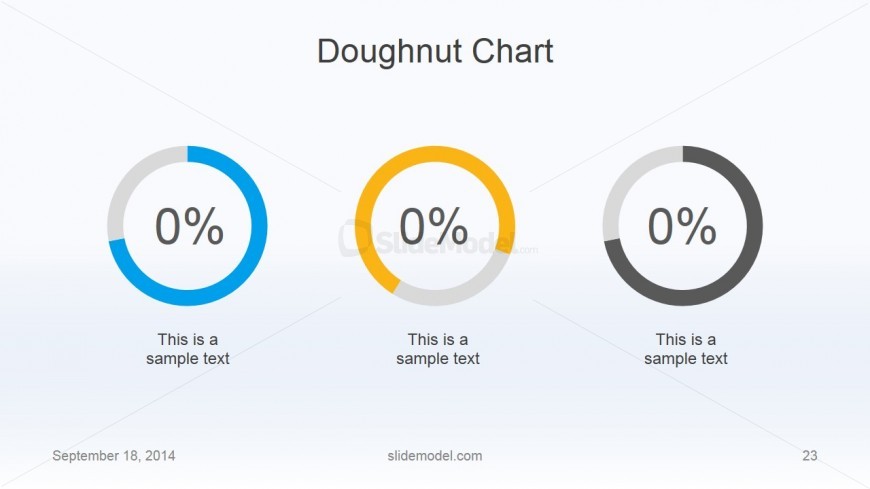
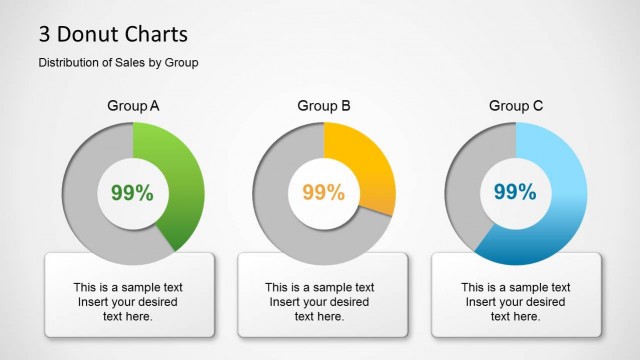
The Flat Business Doughnut Chart Slide Design can be used to show the progress for three stages of a business plan. The different highlighted areas of the doughnut chart can represent the percentages of completion. This can provide the audience with a visual representation of the progress of the plan, shown relatively against the other segments.
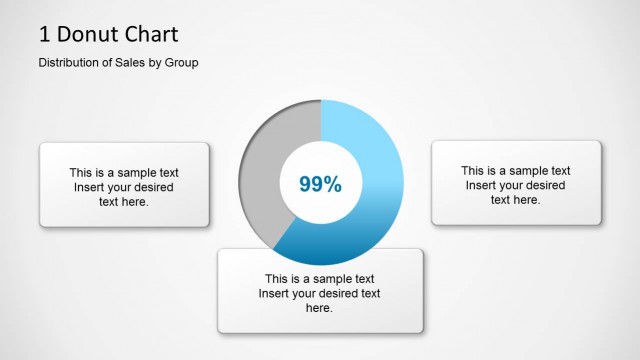
The PowerPoint slide contains three doughnut charts, with highlights in blue, yellow, and black. Each chart contains a percentage and text placeholder for easy identification. The PowerPoint objects are 100% customizable and can be edited to suit the presenter’s needs and preferences.
Return to Flat Business PowerPoint Template.