Slide 1 of 6 from Donut Chart Template for PowerPoint
3 Donut Charts in PowerPoint Slide Design
3 Donut Charts for Sales Distribution
- Chart
- Donut Chart
- Evaluation Slide
- 16:9
- 100% Editable
About This Slide
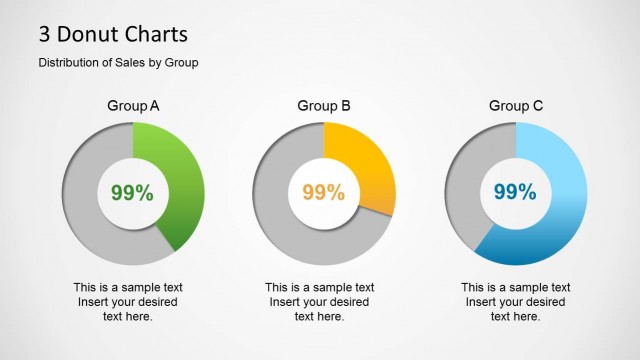
Donut chart PowerPoint slide designs with 3 doughnut charts useful to compare up to three groups of sales and showing distribution of sales in a PowerPoint presentation.
What’s on This Slide
The layout features three donut charts arranged horizontally, each representing sales distribution by group. The charts are circular with a central percentage displayed prominently. Below each chart, there is a rectangular text placeholder for group labels, aligned centrally. The overall background is light, enhancing visibility. Each donut chart has a distinct color segment, with Group A in green, Group B in yellow, and Group C in blue. The visual hierarchy emphasizes the charts and their respective percentages, creating a clear comparison across groups.
How to Use It
This layout serves as a comparative analysis tool, ideal for showcasing sales distribution among different groups. It fits well in presentations discussing performance metrics or sales strategies. It can be used to highlight key performance indicators in sales meetings or quarterly reviews. The three donut charts allow for easy visual comparison, making it suitable for reports on regional sales performance or group achievements. This structure is effective for summarizing data in a concise manner.
Text Placeholders & Capacity
Keep your copy within these limits so it fits without resizing. Node body slots can hold about 8-10 words each.
| Placeholder | Count | Max characters (approx.) |
|---|---|---|
| Item heading | 3 | 30 |
| Item body | 3 | 50 |
| Chart title | 1 | 50 |
Slide Keywords
Download unlimited PowerPoint templates, charts and graphics for your presentations with our annual plan.
DOWNLOADReturn to Donut Chart Template for PowerPoint.