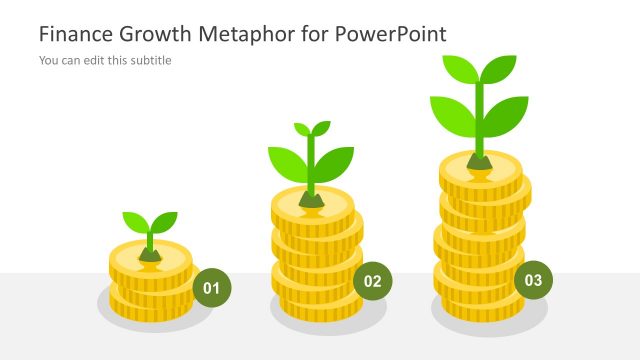
Slide 3 of 3 from Finance Growth Metaphor PowerPoint Template
Stack of Coins Geographic Financial Analysis
Finance Growth Map for Presentations
- Diagram
- Map
- Strategic Analysis Slide
- 16:9
- 100% Editable
What’s on This Slide
The layout features a world map background with gold coin icons positioned at various locations. Arrows in green and red indicate growth and decline, respectively, connecting the coins. Text placeholders are arranged around the map, with some aligned left and others right, allowing for descriptive content. The visual hierarchy emphasizes the coins and arrows, while the map serves as a contextual backdrop. The overall composition is balanced, with a clear flow direction indicated by the arrows. The background is light, enhancing visibility.
How to Use It
This layout serves as a visual representation of financial growth across different regions. It is suitable for presentations discussing global finance strategies, investment opportunities, or market analysis. This slide fits well in a sequence that addresses financial performance or growth metrics, particularly after problem identification and before strategic recommendations. It can be utilized in business meetings, financial reports, or educational contexts focused on finance.
Text Placeholders & Capacity
Keep your copy within these limits so it fits without resizing. Node slots can hold brief descriptions, roughly 5-6 words each.
| Placeholder | Count | Max characters (approx.) |
|---|---|---|
| Item body | 6 | 30 |
| Slide title | 1 | 50 |
| Subtitle | 1 | 50 |
Slide Keywords
Download unlimited PowerPoint templates, charts and graphics for your presentations with our annual plan.
DOWNLOADReturn to Finance Growth Metaphor PowerPoint Template.