Fear & Greed Index Gauge PowerPoint Template
Recognize and discuss various emotional stages of the stock market through our Fear & Greed Index Gauge PowerPoint Template. The fear and greed index is an excellent tool to measure the variations of two primary emotions, i.e., fear and greed, that affect investors and their decisions. Theoretically, this index is prepared by taking an average of seven indicators that cumulatively impact the pricing of shares in a market. These indicators are:
- Market Momentum
- Stock Price Strength
- Stock Price Breadth
- Put and Call Options
- Junk Bond Demand
- Market Volatility
- Safe-Haven Demand
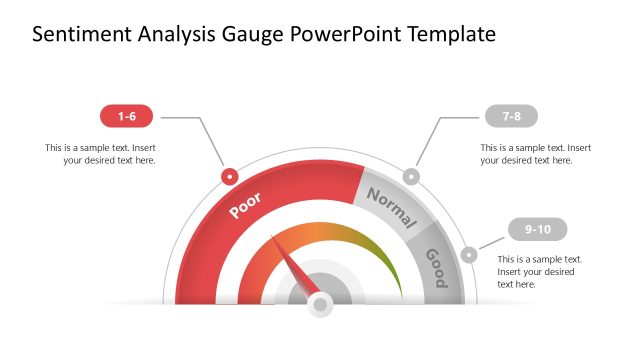
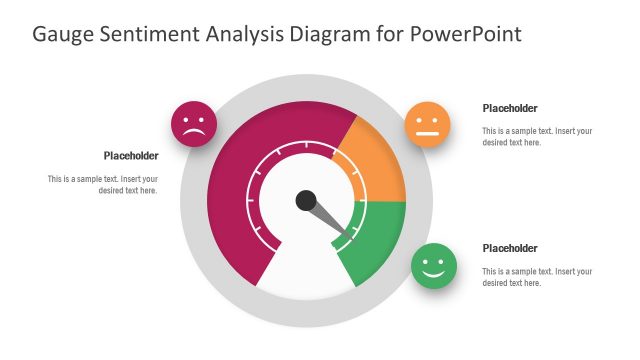
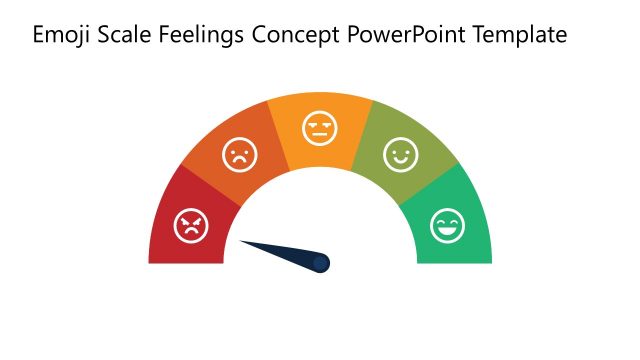
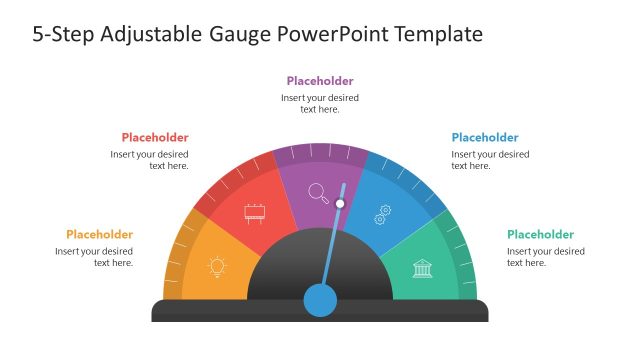
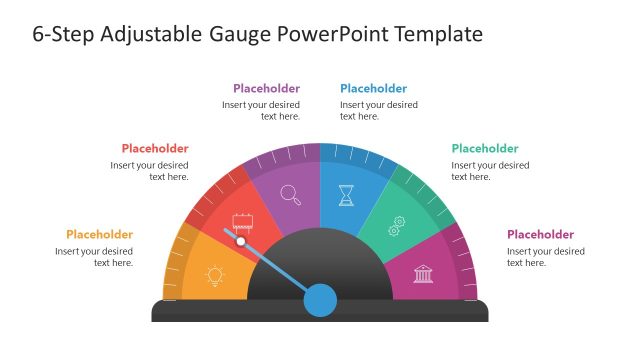
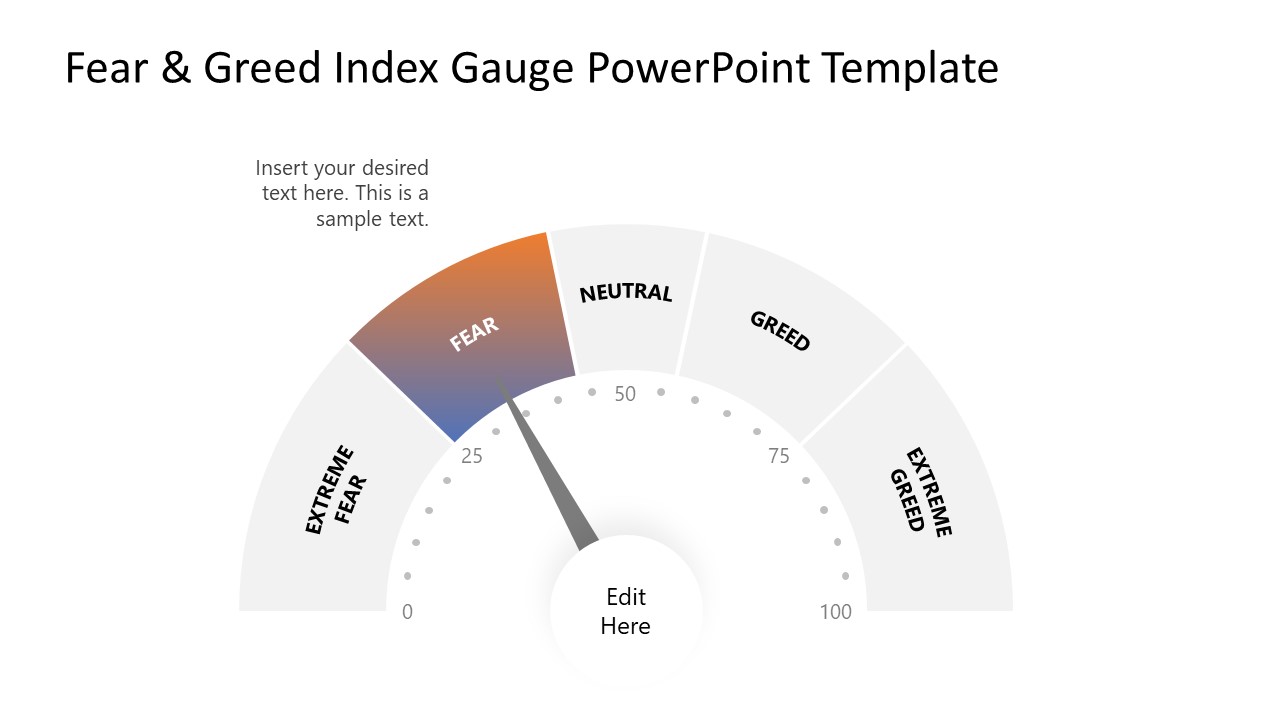
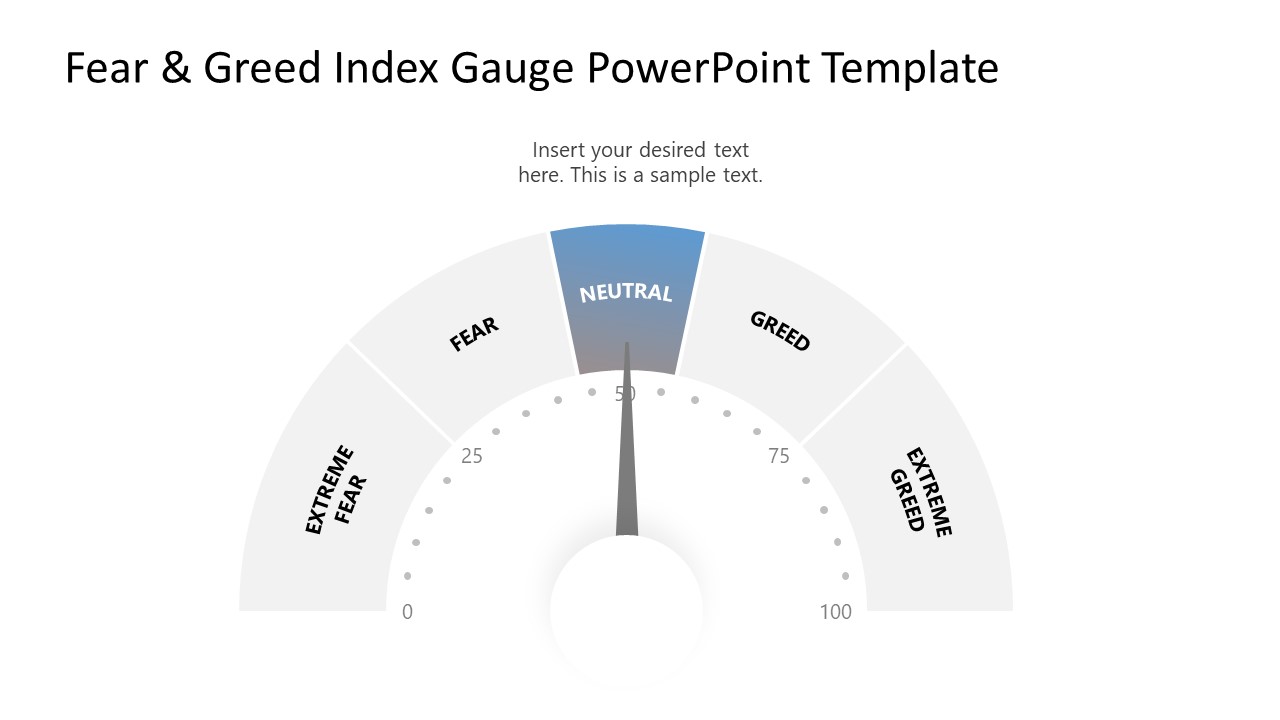
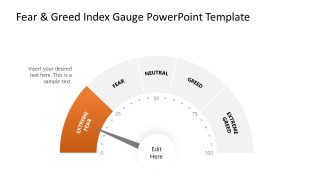
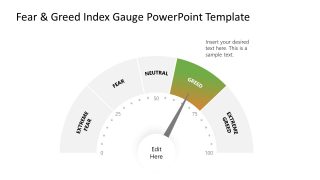
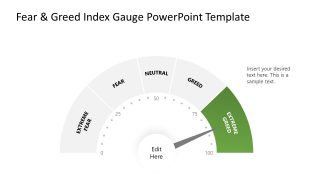
By taking account of these indicators, investors chart the fear and greed index accordingly. So, we have designed an infographic editable layout to present the five states of market sentiment, which is 100% editable in PowerPoint or Google slides, and help professionals portray a practical image of market trends. Using this fear and greed index template, users can technically relate the readings with our diagram, i.e., a gauging meter graduated from 1 to 100. This meter diagram is divided into 5 color-coded sections. Each segment covers the specific graduated area. The first slide of the template shows the colored diagram, while the following color-highlight individual phases for presented to discuss them with more focus.
The Fear & Greed Index Gauge PowerPoint Template also has editable text areas for adding relevant details on separate slides. The pointer’s position also changes concerning the discussed stage, i.e., extreme fear, fear, neutral, greed, and extreme greed. So, presenters can use this template to:
- Discuss different stages of market emotions
- Relate these emotions with the pricing trends of shares
- Guide the investors to achieve better returns on investments
- Correctly orient the behaviors that will positively affect the share values
- Demonstrate how emotional variations cause high and low peaks in shares
However, presenters can use it for other applications not mentioned here. For instance, it can be utilized for business presentations and educational purposes. This PPT template is 100% editable, and users can conveniently change the color scheme, and font styles and add descriptions.


You must be logged in to download this file.
DOWNLOAD- Category
- Diagrams
- Rating

 Loading...
- Size
- 16x9
- Item ID
- 21496-01
- Colors
Subscribe today and get immediate
access to download our PowerPoint templates.