Slide 8 of 18 from Evidence-Based Insights PowerPoint Template
Key Findings Overview with Trend Chart – Evidence Based Insights Deck
Key Findings Overview Slide - Evidence-Based Insights
- Chart
- Line Chart
- Evaluation Slide
- 16:9
- 100% Editable
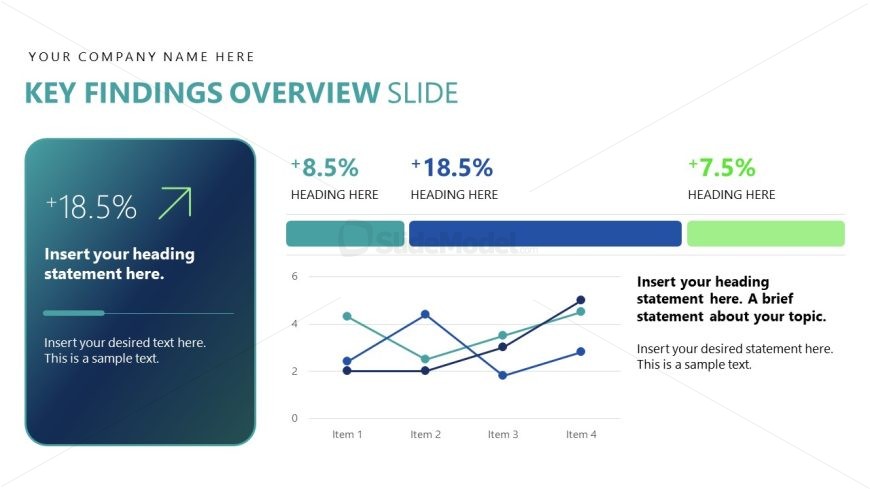
The Key Findings Overview Slide from the Evidence-Based Insights PowerPoint Template offers a clear layout for summarizing critical data trends using editable shapes and a line chart. This slide template supports business presentations by highlighting key metrics and growth indicators, making it suitable for market analysis, performance reviews, or project updates within a professional slide deck.
What’s on This Slide
The layout features a left-aligned box containing a percentage figure and an upward arrow, indicating growth. To the right, three headings with percentage figures are displayed in a row. Below these headings, a line chart spans the width, with four data points connected by lines. The chart has a vertical axis labeled with numerical values and a horizontal axis labeled with item names. Text placeholders are present for headings and descriptions, positioned beneath the percentage figures and above the chart. The overall composition is balanced with a clear visual hierarchy.
How to Use It
This layout serves as a summary slide to present key findings or insights in a concise manner. It fits well in a presentation sequence after introducing a problem or analysis slide, effectively summarizing results. This structure is useful in business contexts such as performance reviews, market analysis, or project updates, where highlighting key metrics is essential. It allows for quick comprehension of important data points and trends.
Text Placeholders & Capacity
Keep your copy within these limits so it fits without resizing. Body slots can hold roughly 10-15 words each.
| Placeholder | Count | Max characters (approx.) |
|---|---|---|
| Slide title | 1 | 30 |
| Item heading | 3 | 10 |
| Item body | 3 | 50 |
| Body paragraph | 2 | 100 |
Slide Keywords
Download unlimited PowerPoint templates, charts and graphics for your presentations with our annual plan.
DOWNLOADReturn to Evidence-Based Insights PowerPoint Template.