Slide 7 of 21 from Investor Presentation PowerPoint Template
Key Metrics Slide with Four Sections
Key Metrics Overview for Investor Presentation
- Text Layout
- Other
- Evaluation Slide
- 16:9
- 100% Editable
The Key Metrics Overview slide from the Investor Presentation PowerPoint Template offers a structured layout to present essential performance indicators clearly. Designed for business presentations, this slide template supports concise communication of investment metrics and financial summaries using editable shapes and vector icons for visual clarity.
What’s on This Slide
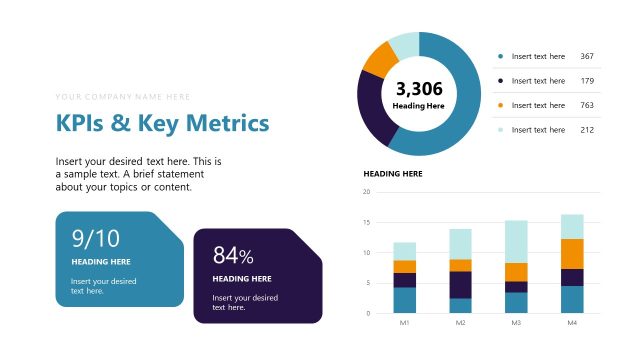
The slide features a title at the top center labeled 'Key Metrics.' Below, there is a large text placeholder for a brief statement about the topic. The layout includes two main sections: a dark blue box on the left containing a percentage figure and a smaller text placeholder below it, and a light blue box beneath that with similar formatting. On the right side, there are four smaller boxes arranged in a 2x2 grid, each containing a percentage figure, a small text placeholder, and an upward or downward arrow. The overall design employs a clean layout with distinct color contrasts.
How to Use It
This layout serves to present key performance indicators or metrics in a clear, organized manner. It fits well in a presentation sequence following introductory slides, providing a snapshot of important data. Suitable for business contexts such as investment pitches, performance reviews, or financial summaries, it effectively communicates essential metrics to stakeholders. The structured format allows for easy comparison of different metrics, making it ideal for highlighting significant data points in a concise way.
Text Placeholders & Capacity
Keep your copy within these limits so it fits without resizing. Body slots can accommodate about 25-30 words each.
| Placeholder | Count | Max characters (approx.) |
|---|---|---|
| Slide title | 1 | 30 |
| Body paragraph | 1 | 150 |
| Item heading | 4 | 10 |
| Item body | 4 | 50 |
Slide Keywords
Download unlimited PowerPoint templates, charts and graphics for your presentations with our annual plan.
DOWNLOADReturn to Investor Presentation PowerPoint Template.