Slide 10 of 18 from Dissertation PowerPoint Template
Key Findings with Bar Chart – Dissertation PPT Template
Key Findings Slide for Dissertation Presentation
- Chart
- Bar Horizontal
- Evaluation Slide
- 16:9
- 100% Editable
The Key Findings Chart slide from the Dissertation PowerPoint Template offers a clear horizontal bar chart layout ideal for presenting research results and summarizing data trends. This slide layout supports effective communication of key statistics within a business presentation or academic pitch deck template, featuring editable shapes and a balanced design to enhance data visualization in professional slide decks.
What’s on This Slide
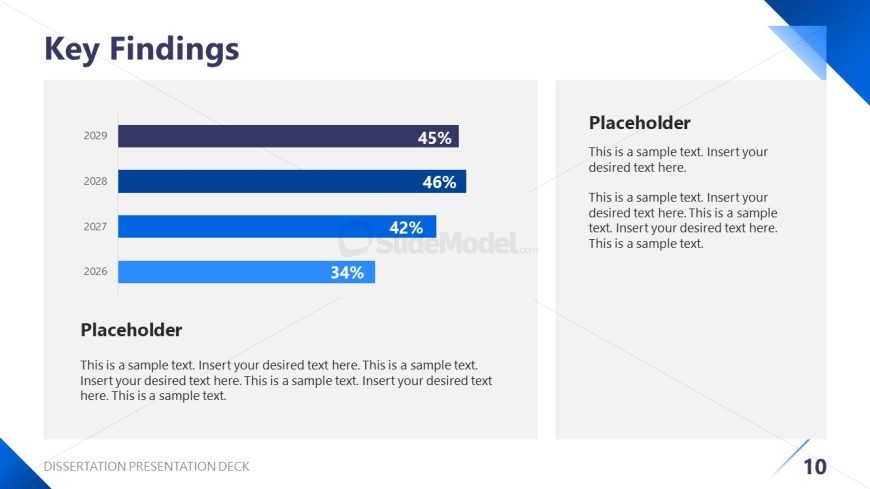
The slide features a horizontal bar chart on the left side, displaying four bars representing percentages for the years 2026 to 2029. Each bar is colored in varying shades of blue, with the longest bar on top and the shortest at the bottom. The right side contains a text placeholder, aligned to the top and bottom, allowing for multiple lines of text. The title 'Key Findings' is prominently displayed at the top in a bold font. The overall background is light gray, providing contrast to the blue bars and text.
How to Use It
This layout serves as a visual representation of key findings, making it suitable for presenting research results or data comparisons. It fits well in a dissertation presentation sequence, particularly after discussing methodology or research context. This structure is useful for summarizing important statistics or trends, allowing for clear communication of findings to an audience. It is ideal for academic or professional settings where data visualization is essential for understanding research outcomes.
Text Placeholders & Capacity
Keep your copy within these limits so it fits without resizing. Body slots can accommodate roughly 20 words each.
| Placeholder | Count | Max characters (approx.) |
|---|---|---|
| Slide title | 1 | 30 |
| Item body | 4 | 10 |
| Body paragraph | 3 | 150 |
Slide Keywords
Download unlimited PowerPoint templates, charts and graphics for your presentations with our annual plan.
DOWNLOADReturn to Dissertation PowerPoint Template.