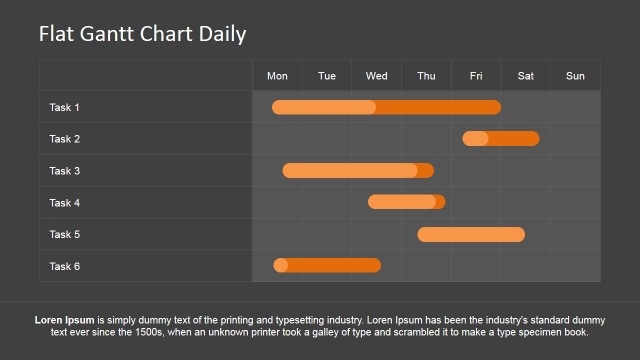
Color Tasks in PowerPoint Gantt Chart
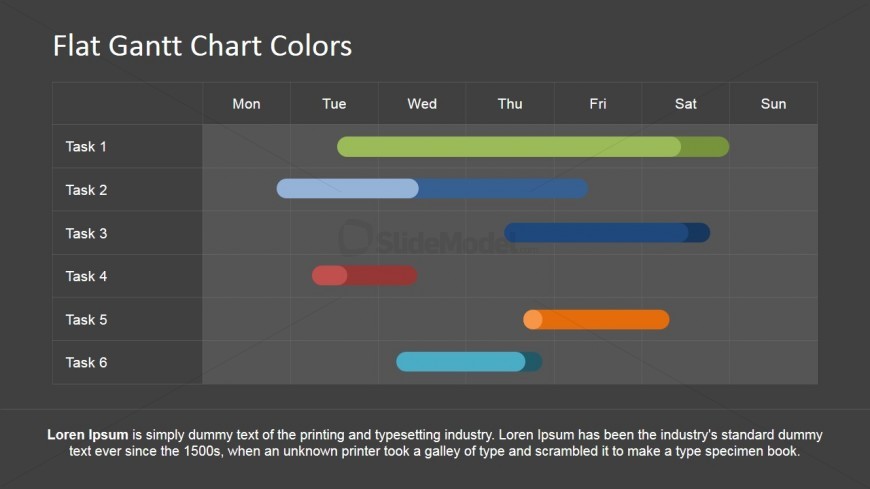
This slide provides an editable Gantt Chart Created with PowerPoint tables and PowerPoint Shapes. Each Task is represented by a table row and two PowerPoint Bar Shapes with Rounded corners. Task Duration and Progress are overlapped to create the effect of completion. Users can fully customize each Task property (color,size, length, effects,etc.). The task labels are simple text placeholders that the user can replace with their task (or task groups) names. The Time Frame presented in this slide is daily, but the user can add columns to the table and create different variations of the timeline.
Return to Editable Gantt Chart for PowerPoint.