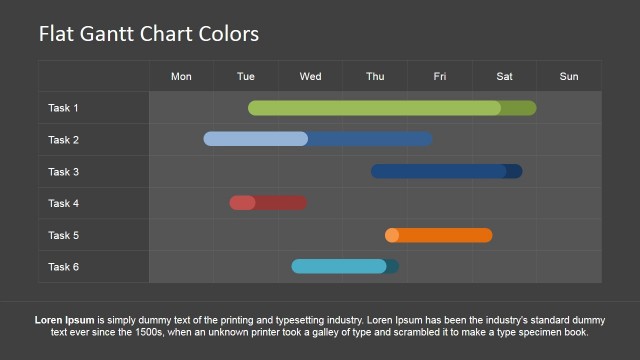
Daily Gantt Chart Timeline for PowerPoint
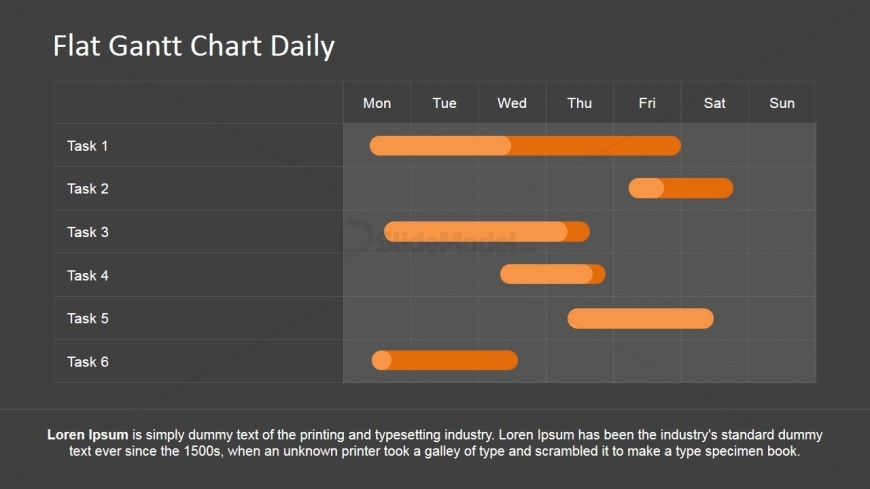
Shown on the PowerPoint slide is a Daily Gantt chart Timeline for PowerPoint. A Gantt chart is a horizontal bar chart which is usually used by managers and organizers for long-term projects and activities. It provides a graphical representation of a schedule of events to help plan, coordinate, and track the different tasks involved in the project. Each bar has two colour variations, which correspond to the scheduled and the planned time for each task.
This slide features a 100% editable PowerPoint Gantt Chart. Each bar is created with PowerPoint shapes. Durations are PowerPoint Shapes overlapped over the task duration bar. Each Row represents a Tasks Labelled in the first column of the table. The Gantt Chart Plot Area has a transparent greyed background to highlight the bars and the grid, making it easy for the audience to distinguish durations. This specific Gantt chart is created over a Daily Schedule, representing a week’s duration, ranging from Monday to Sunday. The PowerPoint objects are 100% editable and can be edited to suit the presenter’s needs and preferences.
Return to Editable Gantt Chart for PowerPoint.