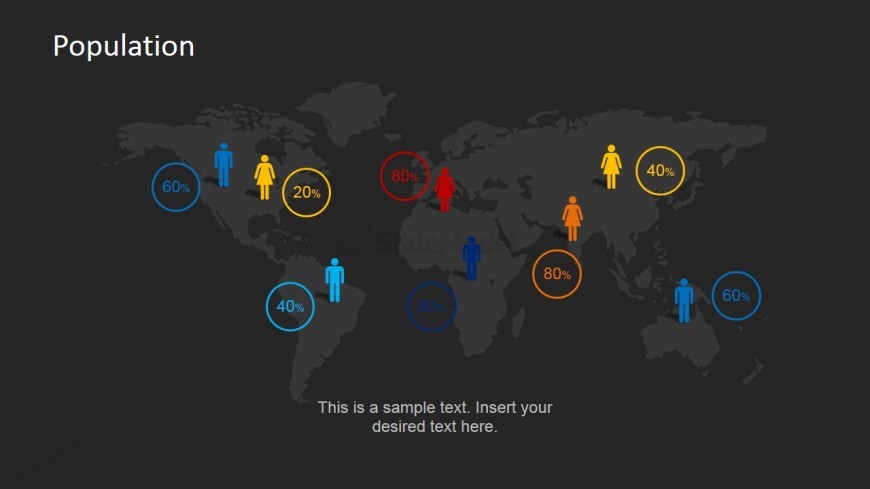
Male and Female Worldmap Demographics Infographic
Located in the slide design is a male and female world map demographics infographic for PowerPoint, which may be used in marketing presentations to illustrate degrees of customer brand loyalty or levels of market penetration for specific focus groups across international channels. It may also be used to show the composition of clients in global markets, and their corresponding percentages in the market shares.
The world map watermark featured on the PowerPoint slide is found against a black presentation background. Across the world map PowerPoint graphic are eight minimalist icons for men and women, colored dark blue, yellow, light blue, red, and orange; each of which have corresponding percentage text placeholders inside circular PowerPoint shapes. The title or short descriptive statement for the PowerPoint template may be inserted in the text placeholder found at the bottom of the slide design. All PowerPoint objects are 100% editable, so as to be easily modified to suit the presenter’s needs and preferences.
Return to Demographics Infographic Elements Clipart for PowerPoint.
Download unlimited PowerPoint templates, charts and graphics for your presentations with our annual plan.
DOWNLOADReturn to Demographics Infographic Elements Clipart for PowerPoint.
