Slide 4 of 32 from #2 Editable Data Driven Maps Bundle
Demographic World Map Template
World Map Demographic Presentation Slide
- Map
- World Map
- Data Analysis Slide
- 16:9
- 100% Editable
What’s on This Slide
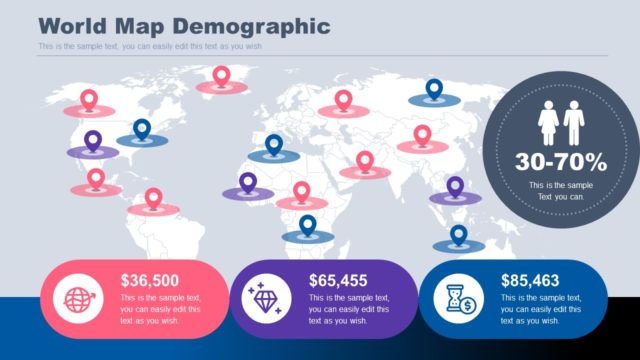
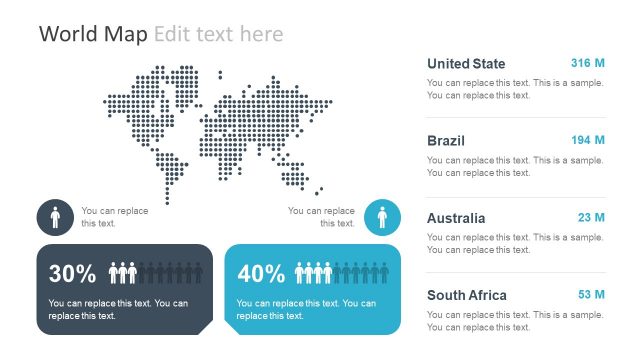
The slide features a world map with demographic data points marked by circular icons in various colors. These icons are distributed across different continents, indicating specific locations. Below the map, there are three rectangular containers, each containing demographic figures and corresponding icons. The text placeholders are positioned within these containers, aligned centrally, and indicate editable content. The background is a gradient of light blue at the top transitioning to darker blue at the bottom, enhancing visual separation. The overall layout emphasizes the map and data points, creating a clear visual hierarchy.
How to Use It
This layout serves as a geographic data visualization tool, ideal for presenting demographic information across different regions. It fits well in a presentation sequence following an introduction to demographic trends or market analysis. Practical applications include showcasing population statistics, economic data, or regional comparisons in business reports or academic studies. This slide can effectively communicate complex data in a visually engaging manner, making it suitable for analysts and presenters aiming to convey geographic insights.
Text Placeholders & Capacity
Keep your copy within these limits so it fits without resizing. Body slots are moderate, roughly 10-15 words each.
| Placeholder | Count | Max characters (approx.) |
|---|---|---|
| Slide title | 1 | 30 |
| Body paragraph | 3 | 50 |
| Item heading | 3 | 15 |
| Item body | 3 | 50 |
| Callout | 1 | 20 |
Slide Keywords
Download unlimited PowerPoint templates, charts and graphics for your presentations with our annual plan.
DOWNLOADReturn to #2 Editable Data Driven Maps Bundle.