Data Processing Flow Diagram for PowerPoint
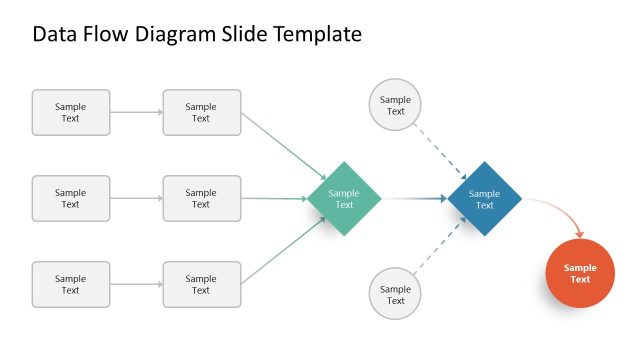
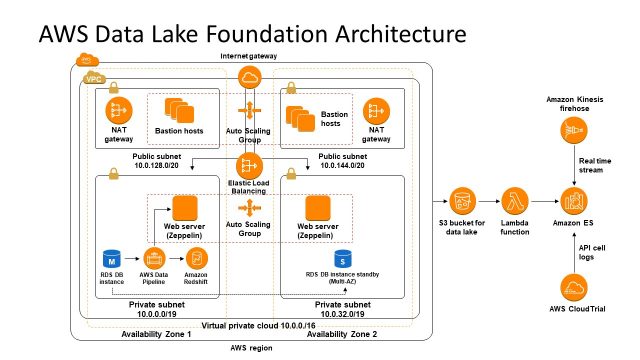
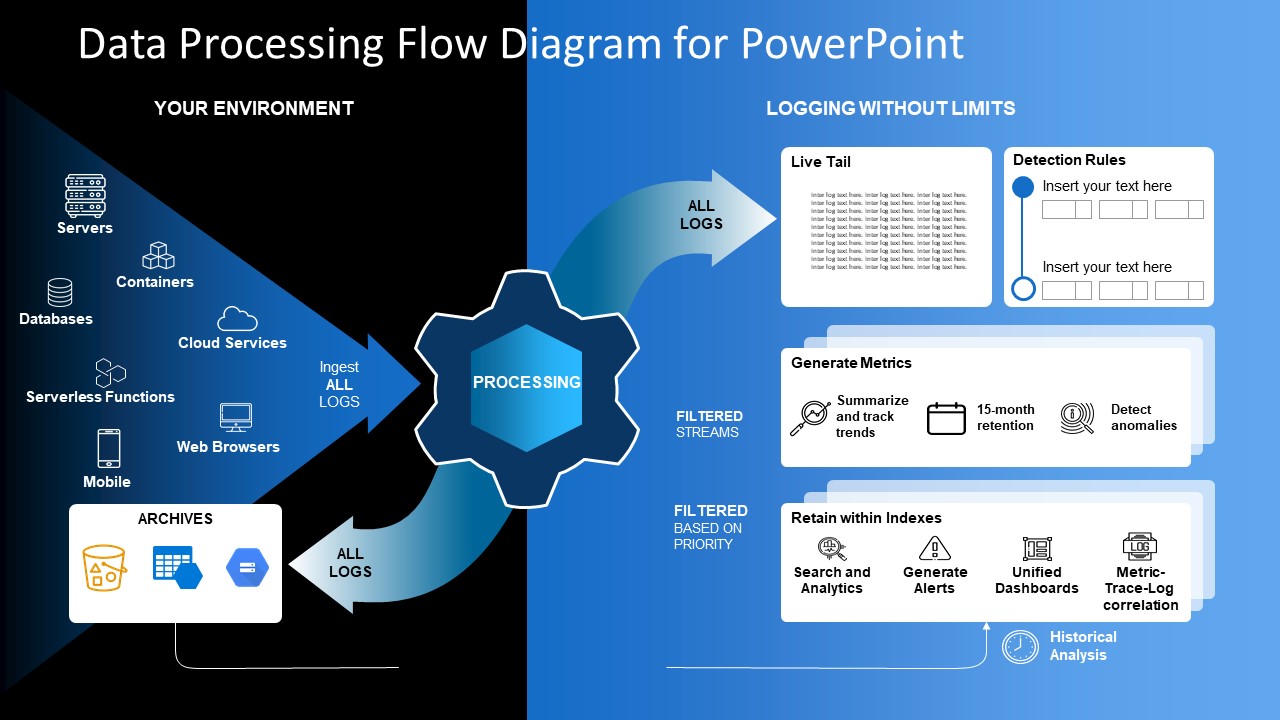
The Data Processing Flow Diagram for PowerPoint presents a log data capture and processing workflow. This process flow diagram explains log management in distributed web architectures. The architecture model extracts log from transactions systems built in different architectures. The processing unit classifies data types and further position logs. It is basically a blueprint of how to collect, process, archive, explore, and monitor log events in a modern architecture.
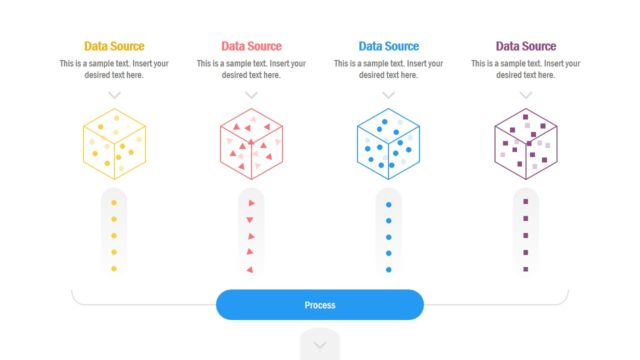
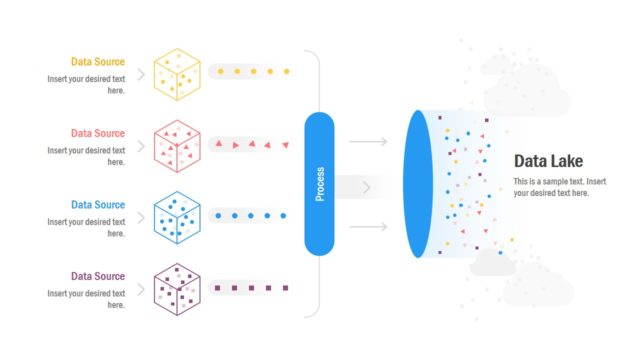
Log data processing begins at data collected from various sources. These data sources include:
- Servers: A centralized resource software or device that provides functionality to connected clients. Data transportation solutions help collect raw data logs from servers in a datacenter.
- Databases: These are organized or structured sets of records which produce transnational and system logs.
- Cloud services: It includes a wide range of on-demand resources without the need for internal infrastructure.
- Server less functions: An event-driven code uploaded on cloud and managed by cloud service companies on behalf of the client. Azure functions are the example of server less computer service by Microsoft, Lamda is the similar service in Amazon.
- Web browsers: Companies trace the digital footprint of visitors from websites such as location, device, and clicks.
- Mobile: The applications on smart devices collect user’s data
The logs collected from all data resources are ingested into the processing unit that produces two output flows. These are:
- Archive data – Cloud storage is an excellent block storage space for raw data such as AWS, Azure, and Google.
- AWS storage (S3) gateway offers services for backup, archives, block storage, data recovery, and more.
- Azure provides multiple storage capacities with their blog and datalake services.
- Google cloud include RESTful, online file storage and web services
- Processing of logs – The transformation of logs and events by filtering and organizing them. There are four components of log collection and integration i.e. detection rules, metrics generation, index creation, and live tail.
- Detection rules: It is a query filter compose of single and sequence terms using Boolean operators.
- Metrics Generation: Enables users to summarize data logs and provide results of a search query from entire ingest stream.
- Retain within Index: Segmentation of data into value groups for analytics and trace-log correlation.
- Live Tail: Overview of all processed log events before indexing.
The user can present a professional and modern log processing architecture with the Data Processing Flow Diagram for PowerPoint template.
You must be logged in to download this file.
DOWNLOAD- Category
- Models
- Rating

 Loading...
- Size
- 16x9
- Item ID
- 13175-02
- Colors
Subscribe today and get immediate
access to download our PowerPoint templates.