Slide 11 of 20 from Data Lineage PowerPoint Template
Data Quality Assessment KPI Dashboard Presentation Template
Data Quality Assessment Slide for Presentations
- Diagram
- Matrix Quadrant
- Evaluation Slide
- 16:9
- 100% Editable
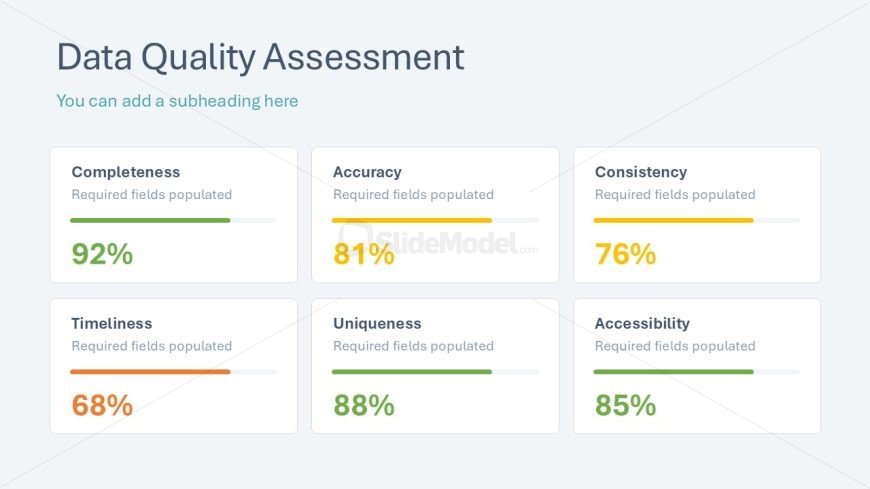
The Data Quality Assessment slide from the Data Lineage PowerPoint Template offers a clear matrix layout to evaluate key data quality metrics. Designed for business presentations, this slide uses editable shapes and progress bars to visually communicate completeness, accuracy, and other metrics, making it ideal for stakeholder updates and data analysis reports within a corporate presentation or slide deck.
What’s on This Slide
The layout features a title at the top center stating 'Data Quality Assessment' with a subheading placeholder below it. Below the title, there are six rectangular nodes arranged in two rows of three. Each node contains a label for a data quality metric, such as 'Completeness' and 'Accuracy,' with a corresponding percentage displayed prominently. The nodes include horizontal progress bars indicating the quality levels, with varying colors representing different metrics. The background is light blue, providing contrast to the elements. Each node maintains a consistent size and spacing.
How to Use It
This layout serves to present a structured assessment of data quality metrics in a concise format. It is suitable for use in business presentations focusing on data management or quality analysis. This slide fits well after discussing data lineage or governance frameworks, allowing for a clear transition into performance metrics. It can be used in scenarios where stakeholders need to understand data quality at a glance, such as in quarterly reviews or project updates.
Text Placeholders & Capacity
Keep your copy within these limits so it fits without resizing. Node labels can hold about 2-3 words each.
| Placeholder | Count | Max characters (approx.) |
|---|---|---|
| Slide title | 1 | 30 |
| Subtitle | 1 | 40 |
| Item heading | 6 | 15 |
| Item body | 6 | 10 |
Slide Keywords
Download unlimited PowerPoint templates, charts and graphics for your presentations with our annual plan.
DOWNLOADReturn to Data Lineage PowerPoint Template.