Venn Diagram Infographic Labels
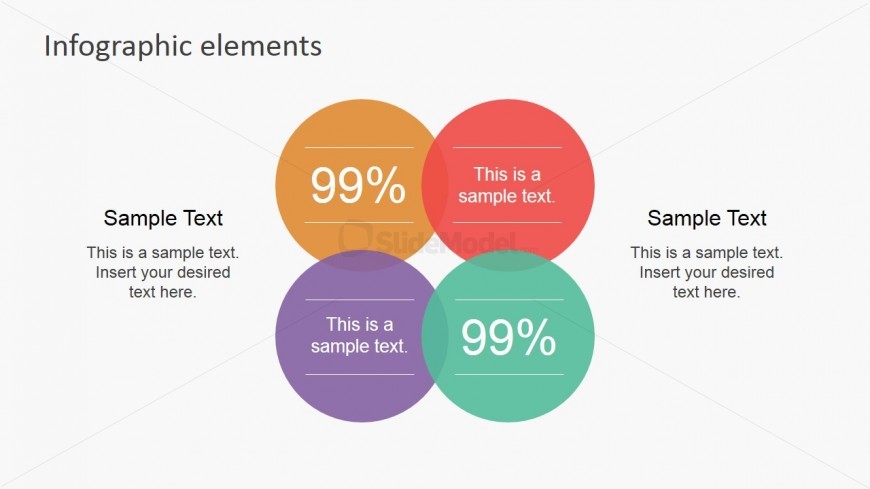
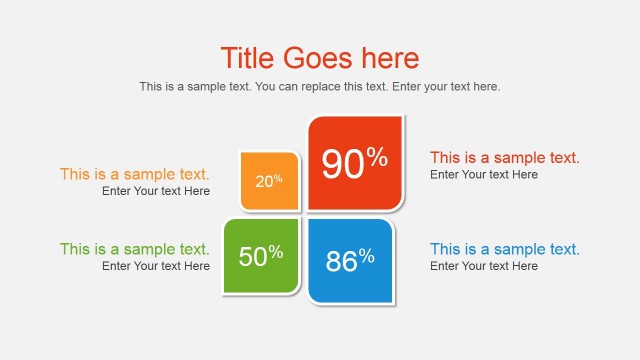
Shown on the PowerPoint slide are Venn diagram infographic labels, which may be used to illustrate the relationship of key elements in a business or marketing presentation. It may also be used to present important components of a business process, and their corresponding statistical information.
Featured on the PowerPoint slide are four overlapping circular PowerPoint shapes, colored in light pastel colors, such as orange, red, violet, and green. Two of the circles contain text placeholders for percentages, while the text placeholders for the remaining circles may be inserted with labels. Two text placeholders found on either side of the PowerPoint diagram may be inserted with descriptions and labels for the presentation design. All PowerPoint objects are 100% editable to suit the presenter’s needs and preferences.