Slide 2 of 3 from Data Driven Fan Chart PowerPoint Template
Uncertainty Forecast PowerPoint Diagram
Forecast Diagram for Data Analysis
- Chart
- Line Chart
- Forecast Slide
- 16:9
- 100% Editable
What’s on This Slide
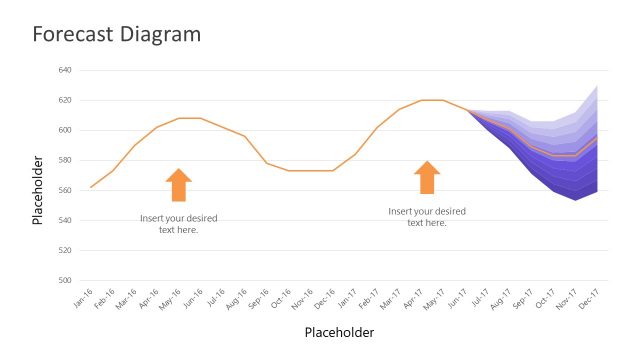
The slide features a line chart with a purple background. The chart displays a forecast trend with a solid line representing data points, and a shaded area indicating uncertainty. Two arrows point to specific data points, each accompanied by text placeholders for additional information. The x-axis is labeled with monthly intervals from January 2016 to December 2017, while the y-axis shows values ranging from 500 to 640. Text placeholders are located at the top and bottom of the chart, aligned centrally, allowing for clear visibility against the background.
How to Use It
This layout serves as a forecast diagram, ideal for presenting data trends over time. It fits well in a sequence following an analysis or problem identification slide, providing a visual representation of projected outcomes. This structure is useful in business contexts such as project status updates, financial forecasts, or performance reviews, where conveying uncertainty and trends is essential. It can be used to highlight key data points and engage stakeholders in discussions about future projections.
Text Placeholders & Capacity
Keep your copy within these limits so it fits without resizing. Text slots are moderately sized, with room for concise entries.
| Placeholder | Count | Max characters (approx.) |
|---|---|---|
| Chart title | 1 | 20 |
| Item body | 2 | 30 |
| Axis label | 2 | 10 |
| Footer | 1 | 20 |
Slide Keywords
Download unlimited PowerPoint templates, charts and graphics for your presentations with our annual plan.
DOWNLOADReturn to Data Driven Fan Chart PowerPoint Template.