Slide 4 of 4 from Customer Journey Map Diagram for PowerPoint
6162-01-customer-journey-map-4
Customer Journey Map Diagram for PowerPoint
- Diagram
- Process Flow
- Customer Journey Slide
- 16:9
- 100% Editable
The Customer Journey Map Diagram slide from the Customer Journey Map Diagram for PowerPoint template visually tracks customer satisfaction trends using a line graph with editable shapes and vector icons. This slide layout is suitable for business presentations focused on marketing strategy or customer experience analysis, providing clear insights into positive experiences over time within a corporate presentation or pitch deck template.
What’s on This Slide
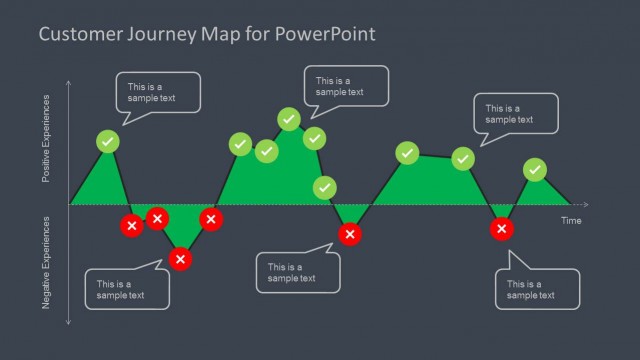
The slide features a line graph depicting positive experiences over time. The vertical axis is labeled 'Positive Experiences,' while the horizontal axis is labeled 'Time.' The graph consists of green peaks and valleys, indicating varying levels of customer satisfaction. Speech bubbles with sample text are positioned above certain peaks, providing context for specific experiences. Green checkmarks are placed at various points along the graph, emphasizing significant positive experiences. The background is dark, enhancing the visibility of the graph and text elements.
How to Use It
This layout serves as a visual representation of customer experiences over time, ideal for illustrating trends in customer satisfaction. It fits well in a presentation sequence that discusses customer feedback or experience analysis. This structure can be used in business scenarios such as marketing presentations, customer experience assessments, or strategic planning discussions. It effectively communicates the highs and lows of customer interactions, making it suitable for stakeholder reviews or team discussions on improvement areas.
Text Placeholders & Capacity
Keep your copy within these limits so it fits without resizing. Node body slots can hold roughly 5-7 words each.
| Placeholder | Count | Max characters (approx.) |
|---|---|---|
| Chart title | 1 | 30 |
| Item body | 5 | 25 |
| Item heading | 5 | 15 |
Slide Keywords
Download unlimited PowerPoint templates, charts and graphics for your presentations with our annual plan.
DOWNLOADReturn to Customer Journey Map Diagram for PowerPoint.