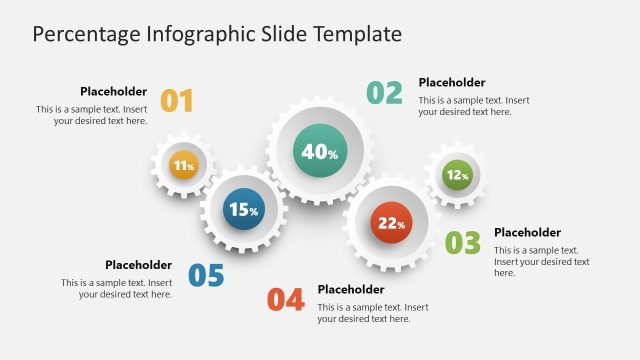
Creative Percentage Infographic Slide Template
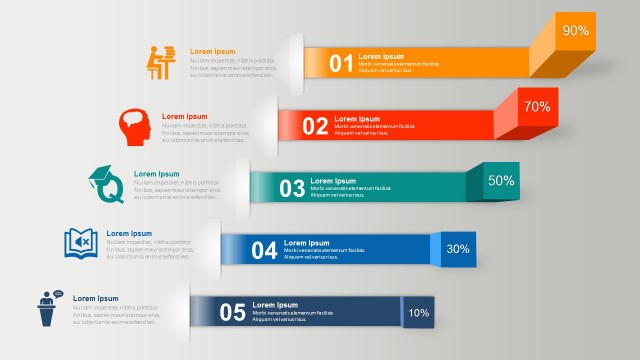
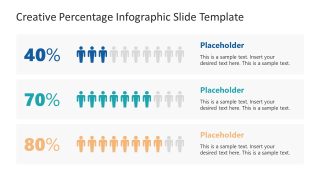
The Creative Percentage Infographic Slide Template is designed to showcase different percentage values using infographic illustrations. Displaying percentages is required for many purposes, such as discussing survey results, social studies, impact studies, and voting results. Healthcare, business, and marketing professionals often represent their findings in percentage charts and infographics. So, we have designed this interactive presentation template with multiple representations of human silhouette infographics to showcase percentages creatively. Presenters can choose from their required representations and personalize them according to their presentation values. This PPT template is 100% editable with PowerPoint, Google Slides, and Keynote software.
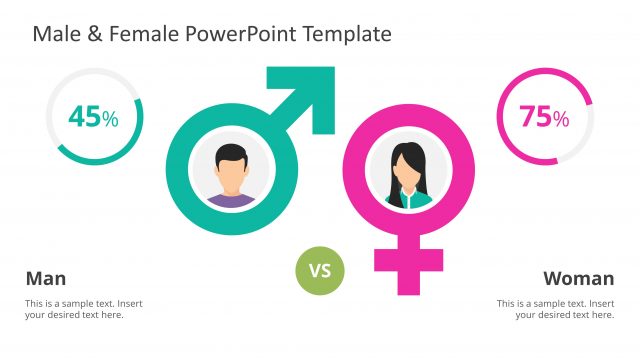
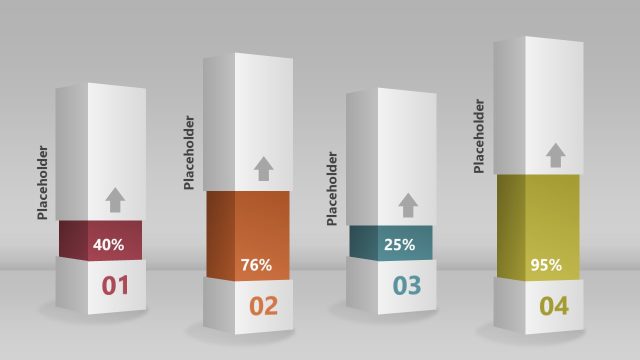
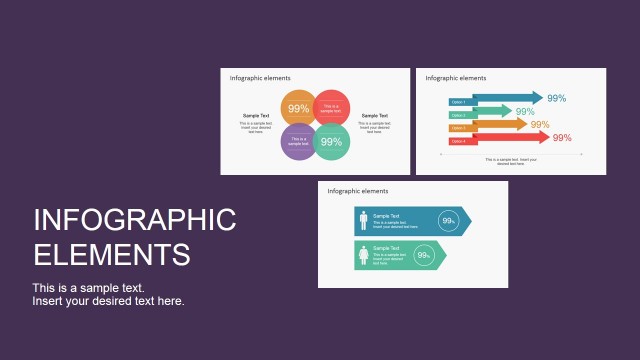
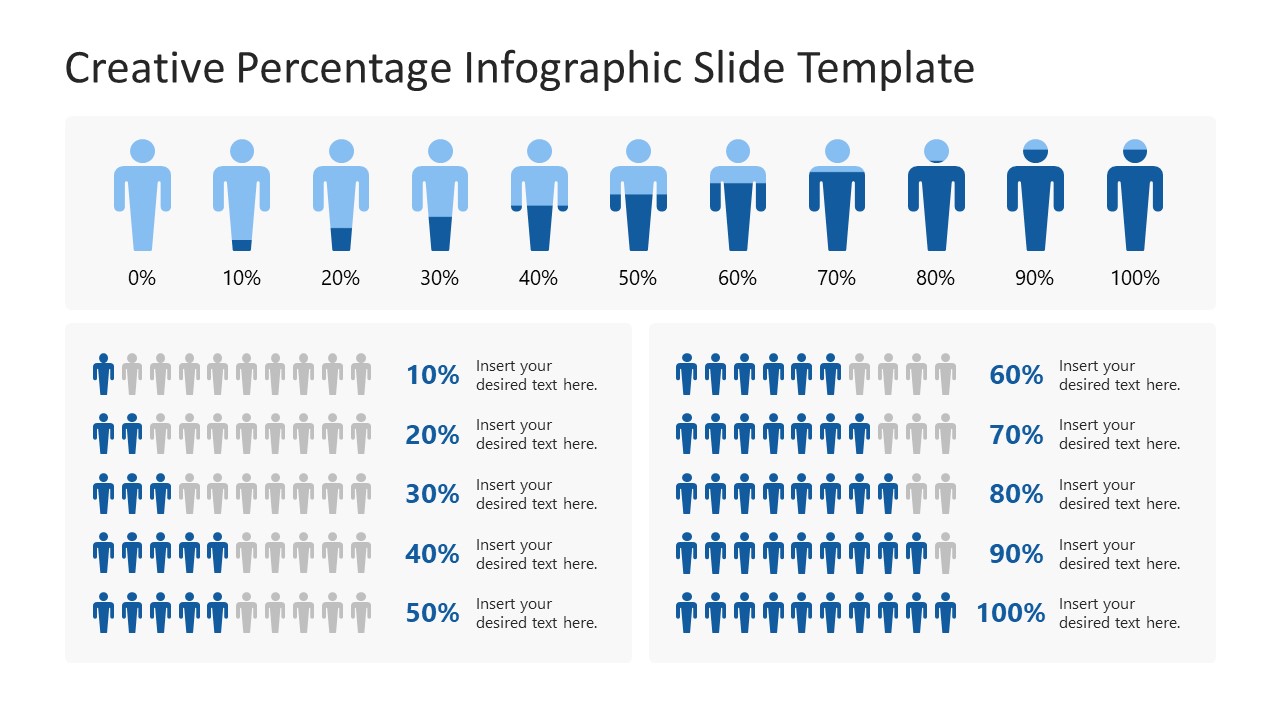
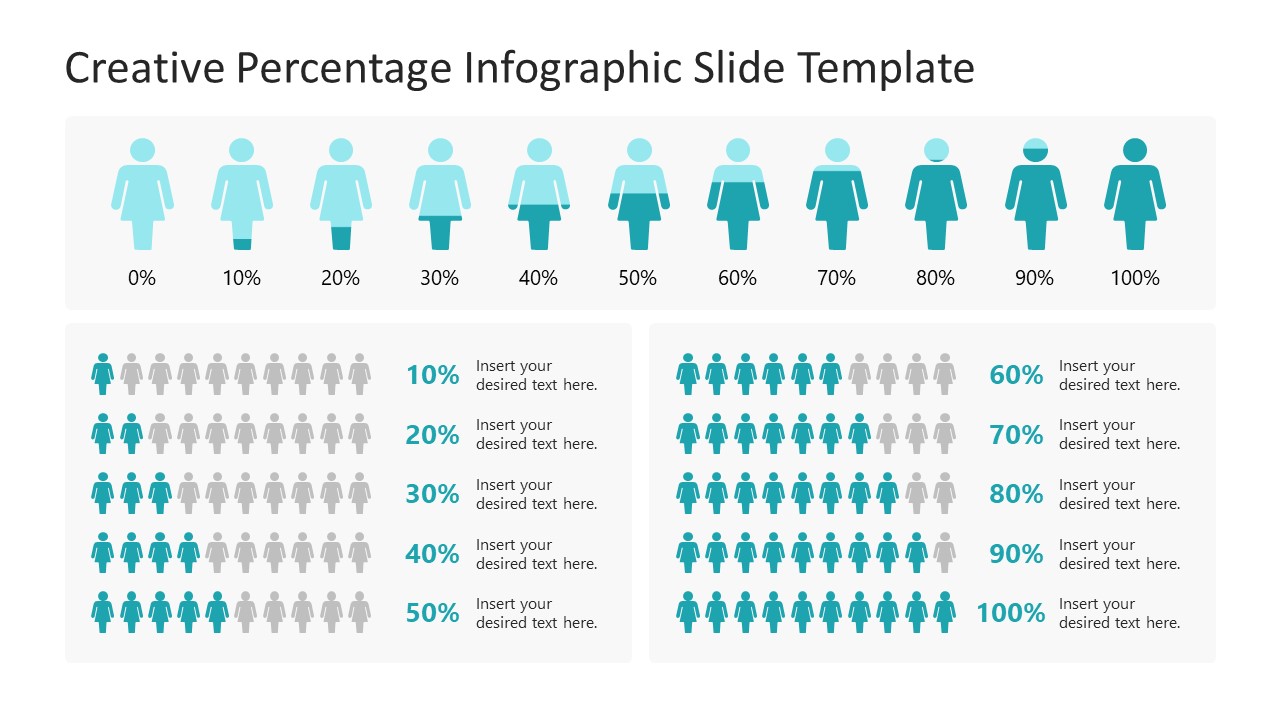
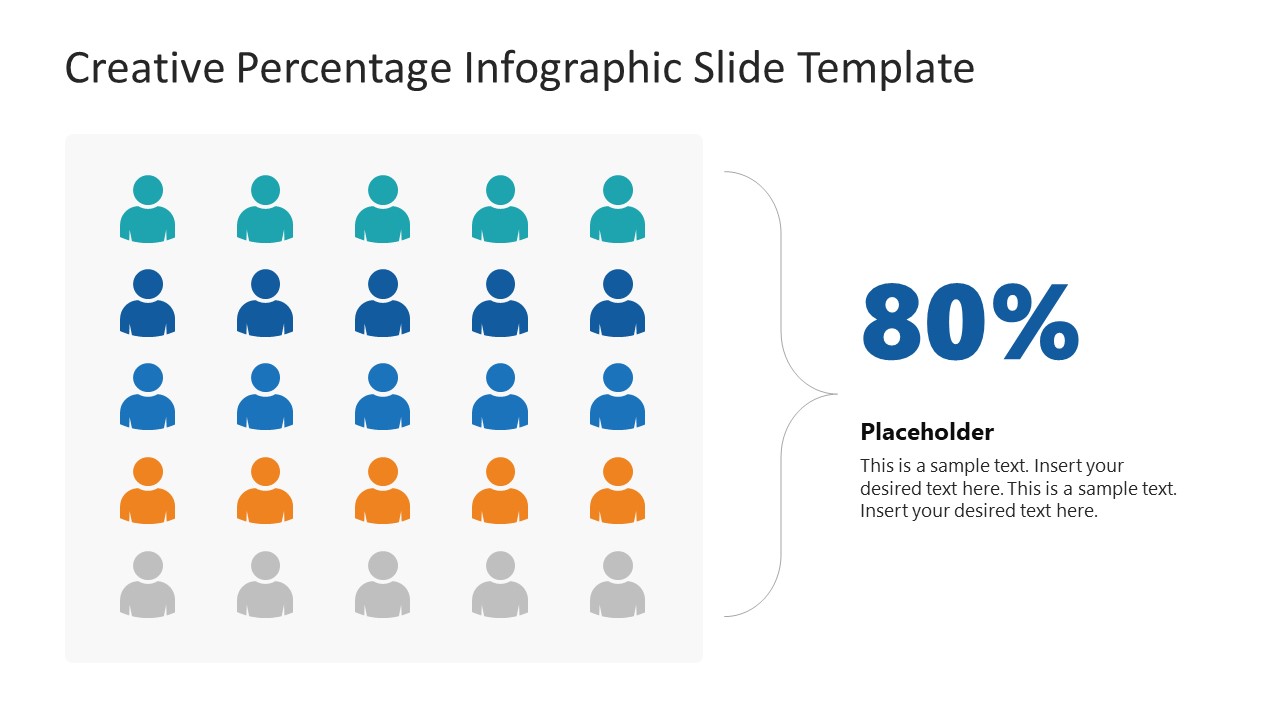
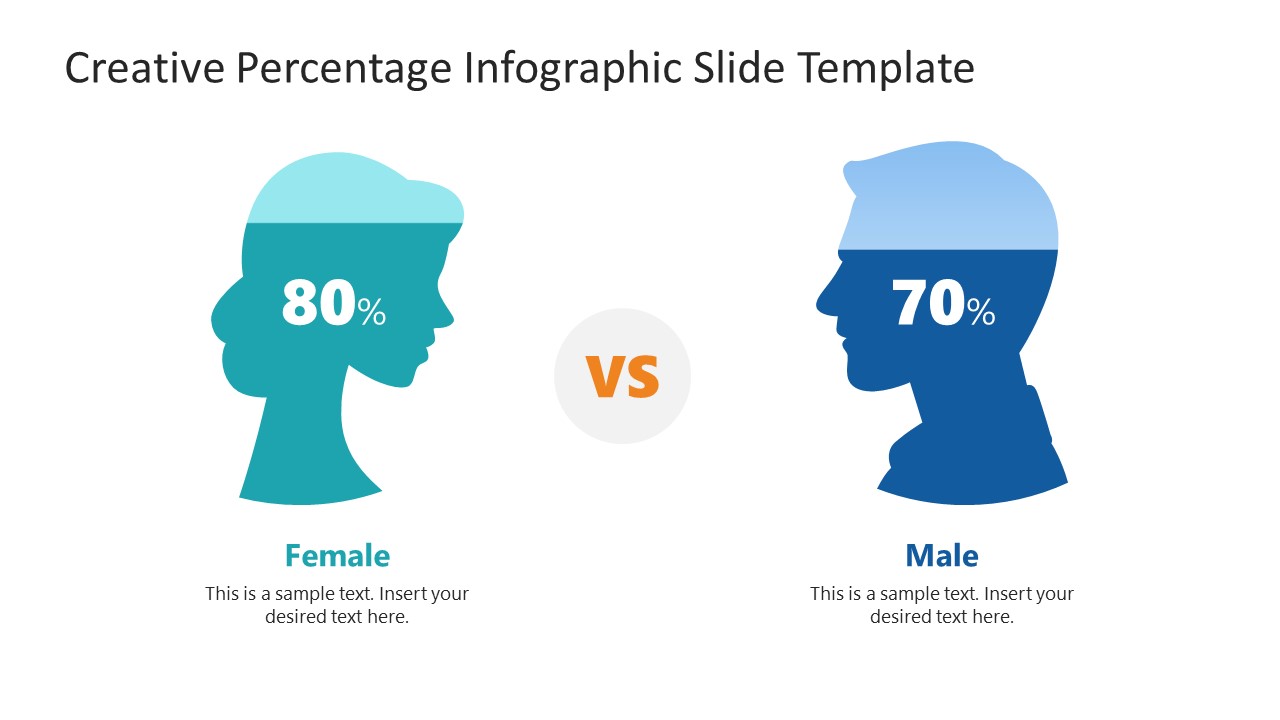
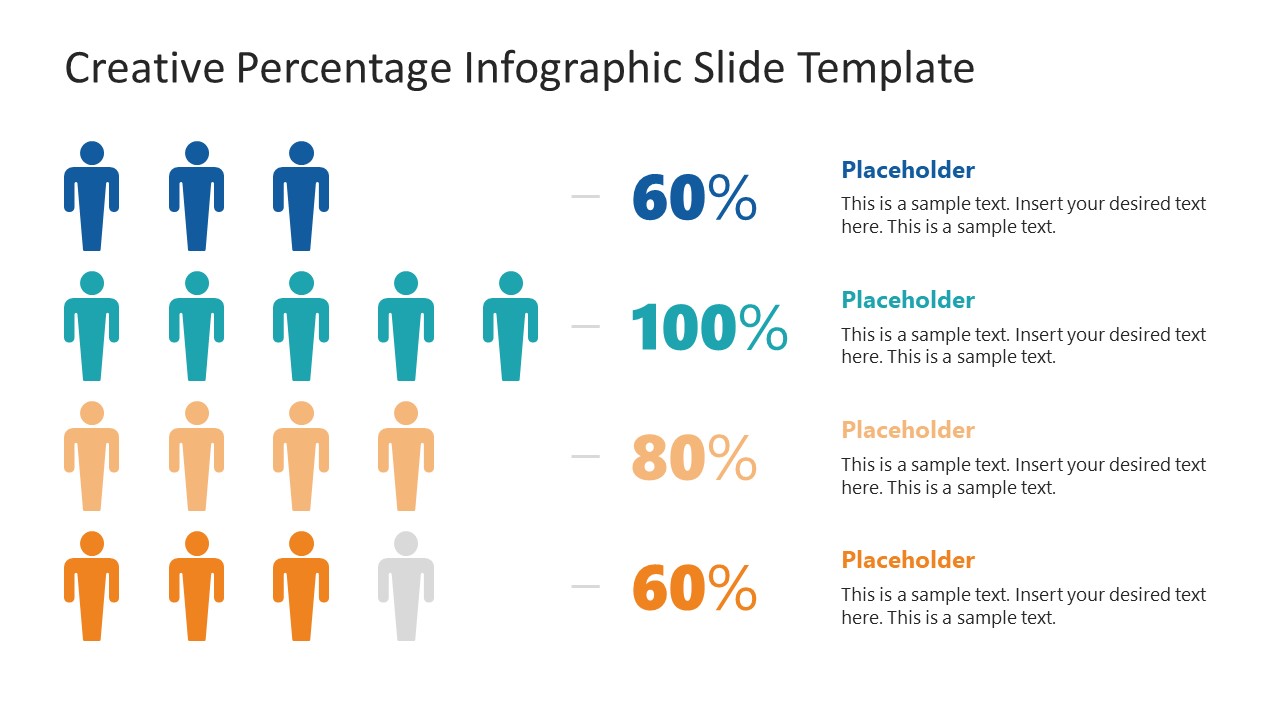
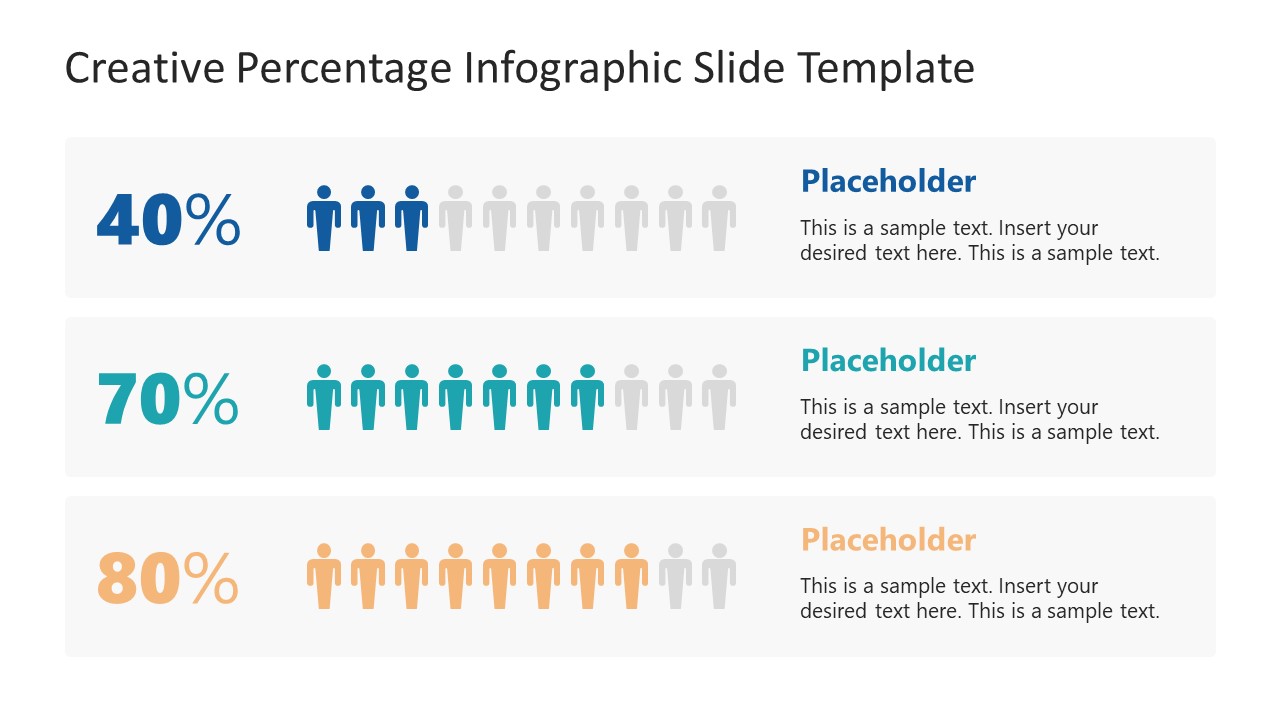
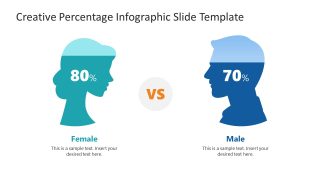
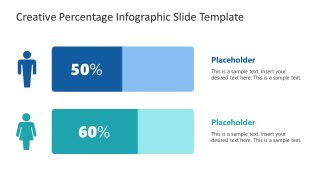
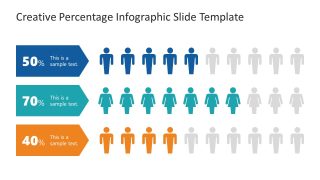
This Creative Percentage Infographic Slide Template carries eight slides with different percentage representations using male and female human symbols. A row of human silhouettes with differential color fills the first slide according to percentage values. It also contains a chart of small human symbols with color-filled symbols according to the percentage values, i.e., for 10%, 1 out of 10 symbols are dark. The next slide is the same but carries female symbols instead of male. These slides can be used as a guide on what the shading represents for different percentage values. There are other creative representations on the following slides. For instance, a male face and a female face silhouette are filled with percentages mentioned on their sides, different numbers of icons are given with percentages mentioned in their corresponding colors, and a group of icons is provided on the slide to show a collective percentage.
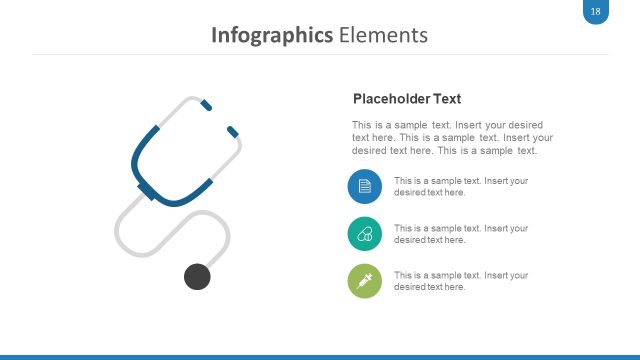
These infographic illustrations can be used in presentations, meetings, brainstorming or voting sessions, showing judgment results, general interests, and medical research. Professionals can conveniently download and copy the infographics for their use cases. So, download and edit this best PPT template for your presentations now!


You must be logged in to download this file.
DOWNLOAD- Category
- Data & Charts
- Rating

 Loading...
- Size
- 16x9
- Item ID
- 22180-01
- Colors
Subscribe today and get immediate
access to download our PowerPoint templates.