Connecticut US State PowerPoint Map
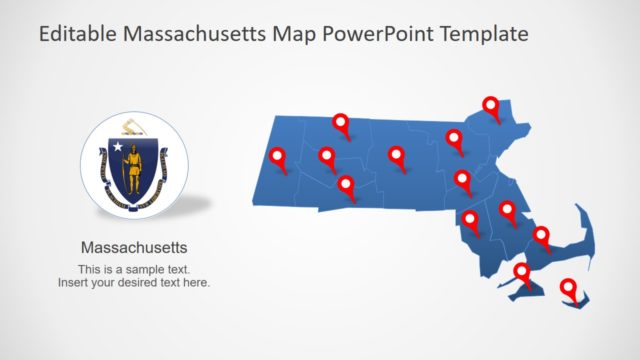
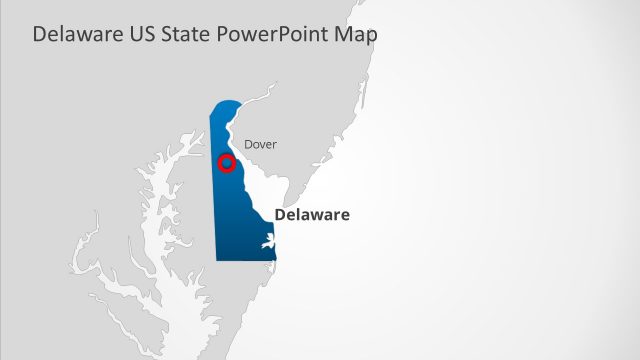
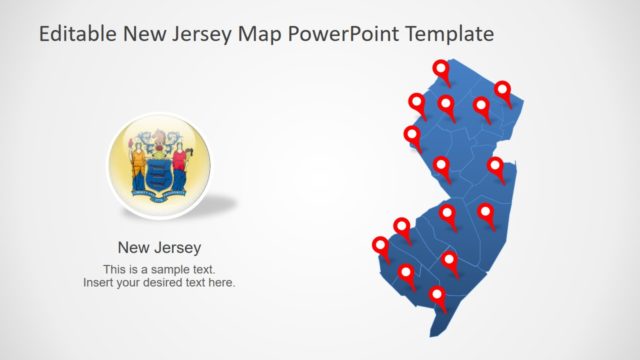
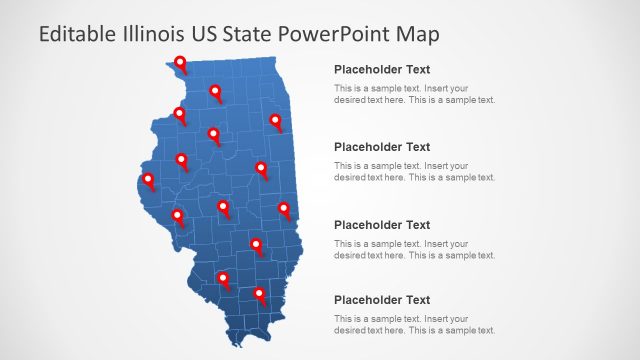
The Connecticut US State PowerPoint Map presents counties of the USA state. These map templates show the physical features of the Connecticut state. There are 7 slides of Connecticut maps include flags and location markers. The silhouette maps here provide creative variations of Connecticut’s geographical region by outlining borders. These variations, with the help of location markers, flag shapes, and colors create an engaging presentation. The users can label counties, cities, and regions using text placeholders available in PowerPoint templates.
Connecticut is the 3rd smallest state in the USA and also the fourth-most densely populated. It is a connected to New York Tri-State area, Massachusetts in North, Rhode Island in east, and Long Island Sound in south. Connecticut is unofficially known as Nutmeg State and the Land of Steady Habits. The maps can help demonstrate multiple aspects of Connecticut. Such as climate, economy, population statistics, tourism, business, and more.
The Connecticut US State PowerPoint Map lets users change colors of different regions depicting Connecticut satellite images. The slides of editable maps let users change colors, shapes, or move location markers to pinpoint a specific region. For example, display the outline map of counties highlighting business reach. Similarly, change the colors of each counties to display climate change. You can also download the complete map of the USA and North America for a complete picture of region. Afterward, create a focus on Connecticut map for details.


