Slide 2 of 5 from CAPM Capital Asset Pricing Model Curve for PowerPoint
6216-01-camp-curve-blue-2
CAPM Curve for Financial Analysis
- Diagram
- Other
- Concept Explanation Slide
- 16:9
- 100% Editable
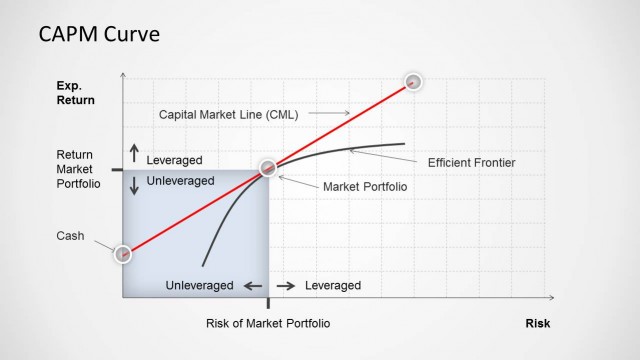
The CAPM Curve Diagram slide from the CAPM Capital Asset Pricing Model Curve for PowerPoint template provides a clear visual tool for illustrating the relationship between expected return and market risk. Ideal for financial presentations, this slide uses editable shapes and vector icons to enhance explanations of investment strategies and portfolio risk management within a corporate presentation or educational finance context.
What’s on This Slide
The slide features a CAPM curve diagram with axes labeled 'Exp. Return' and 'Risk of Market Portfolio.' A red curve illustrates the relationship between expected return and risk, with nodes indicating leveraged and unleveraged positions. A blue box on the right contains a text placeholder for additional data, while another placeholder is positioned near the curve. The background is light, enhancing the visibility of the graph elements. Grid lines are present to assist in interpreting the data, and the overall layout is structured for clarity.
How to Use It
This layout serves as a visual representation of the Capital Asset Pricing Model, illustrating the trade-off between risk and expected return. It fits well in a financial presentation sequence, particularly after problem framing or before discussing investment strategies. This diagram is useful for finance professionals explaining investment decisions, portfolio management, or educational contexts focused on financial theory and risk assessment.
Text Placeholders & Capacity
Keep your copy within these limits so it fits without resizing. Node labels can accommodate brief phrases, while body text is limited to a few sentences.
| Placeholder | Count | Max characters (approx.) |
|---|---|---|
| Slide title | 1 | 20 |
| Item heading | 2 | 15 |
| Item body | 1 | 50 |
Slide Keywords
Download unlimited PowerPoint templates, charts and graphics for your presentations with our annual plan.
DOWNLOADReturn to CAPM Capital Asset Pricing Model Curve for PowerPoint.