Slide 2 of 2 from Simple Efficient Frontier Curve for PowerPoint
6216-03-camp-efficient-frontier-curve-2
Efficient Frontier Curve Diagram for Finance
- Diagram
- Other
- Concept Explanation Slide
- 16:9
- 100% Editable
The Efficient Frontier Curve slide from the Simple Efficient Frontier Curve for PowerPoint template visually explains the balance between risk and expected return in investment strategy discussions. This slide layout is ideal for corporate presentations and financial education sessions, offering editable shapes and vector icons to highlight key concepts like the Capital Market Line and market portfolio risk. It integrates well into business presentation slide decks focused on portfolio management and risk assessment.
What’s on This Slide
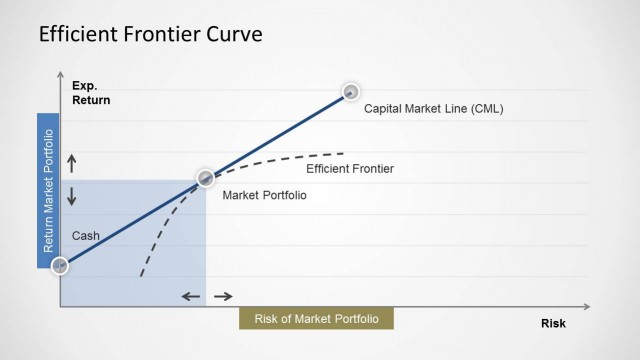
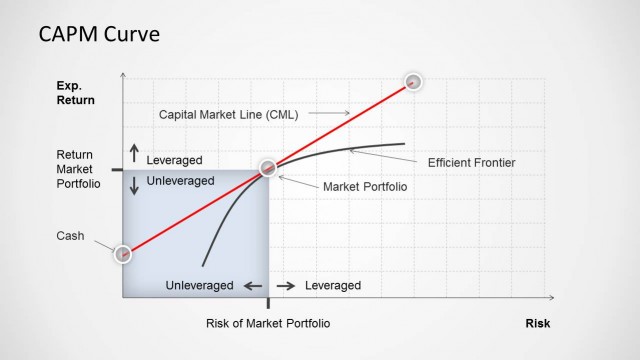
The layout features a graph with a diagonal curve representing the Efficient Frontier, positioned centrally. The vertical axis is labeled 'Exp. Return' and the horizontal axis is labeled 'Risk of Market Portfolio.' Key elements include the Capital Market Line (CML), marked with a dashed line, and points labeled 'Cash' and 'Market Portfolio.' Text placeholders are located on the right side, aligned in a vertical stack. Each placeholder has a blue background, with the first placeholder at the top. The overall color scheme is light with blue accents.
How to Use It
This diagram serves to illustrate the relationship between risk and expected return in portfolio management. It fits well in financial presentations, particularly when discussing investment strategies or risk management. The layout is effective for explaining concepts like the Efficient Frontier and Capital Market Line. It can be used in educational settings or corporate finance meetings to visualize optimal portfolio selection and risk assessment.
Text Placeholders & Capacity
Keep your copy within these limits so it fits without resizing. Node labels can hold about 3-5 words each.
| Placeholder | Count | Max characters (approx.) |
|---|---|---|
| Slide title | 1 | 30 |
| Item heading | 3 | 20 |
| Item body | 3 | 30 |
Slide Keywords
Download unlimited PowerPoint templates, charts and graphics for your presentations with our annual plan.
DOWNLOAD