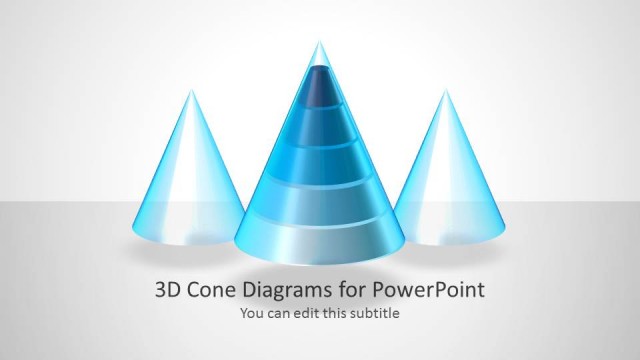
Slide 1 of 6 from Candle Light Shapes & Charts for PowerPoint
6090-01-candle_light_charts-1
Candle Light Charts for PowerPoint
- Media Layout
- Other
- Context Slide
- 16:9
- 100% Editable
The Candle Light Charts slide from the Candle Light Shapes & Charts for PowerPoint template offers an engaging introduction for business presentations. Featuring editable shapes of colorful candles symbolizing growth and illumination, this slide enhances thematic visual displays. It is ideal for setting the tone in corporate presentations or pitch deck templates that require symbolic data representation using vector icons and slide templates.
What’s on This Slide
The slide features three cylindrical candle shapes in varying colors: orange, blue, and dark blue. Each candle has a flame represented by a circular shape above it. The candles are centered horizontally, with the orange candle on the left, the blue candle in the middle, and the dark blue candle on the right. Below the candles, there is a title placeholder aligned center, stating 'Candle Light Charts for PowerPoint,' and a subtitle placeholder below it that reads 'You can edit this subtitle.' The background is a light gradient, enhancing the visual appeal.
How to Use It
This layout serves as an introductory slide, suitable for presenting topics related to candle light charts or visual representations of data. It fits well at the beginning of a presentation to capture attention and set the theme. This design can be used in business scenarios where symbolism or metaphorical representations are needed, such as illustrating growth, warmth, or illumination in a project or idea. It is effective for engaging audiences in discussions about progress or concepts.
Text Placeholders & Capacity
Keep your copy within these limits so it fits without resizing. Title and subtitle slots can accommodate concise text, roughly 5-8 words each.
| Placeholder | Count | Max characters (approx.) |
|---|---|---|
| Slide title | 1 | 35 |
| Subtitle | 1 | 30 |
Slide Keywords
Download unlimited PowerPoint templates, charts and graphics for your presentations with our annual plan.
DOWNLOADReturn to Candle Light Shapes & Charts for PowerPoint.