Slide 4 of 6 from Candle Light Shapes & Charts for PowerPoint
6090-01-candle_light_charts-4
Candle Light Chart for Presentations
- Diagram
- Other
- Process Slide
- 16:9
- 100% Editable
The Candle Light Chart with Text slide from the Candle Light Shapes & Charts for PowerPoint template offers a clear process diagram ideal for business presentations. This slide layout combines editable shapes and text placeholders to visually track performance and project milestones, making it a practical addition to any corporate presentation or pitch deck template.
What’s on This Slide
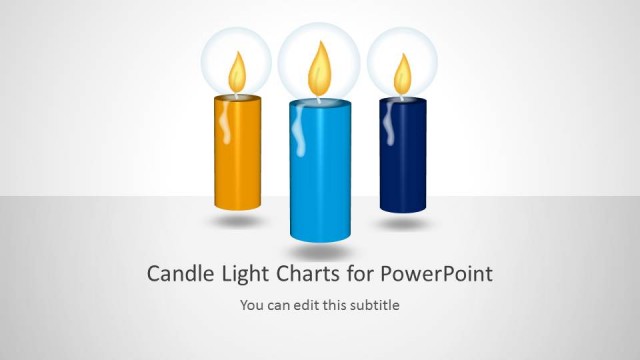
The layout features three stylized candle shapes arranged vertically on the right side. Each candle has a flame and a colored base, with the tallest candle in blue, the middle in gray, and the shortest in yellow. To the left, there are five text placeholders stacked vertically, aligned to the right of the candles. Each placeholder has a title and a body text area, allowing for detailed descriptions. The background is light with a subtle gradient, enhancing the visual appeal. The overall composition is clean, with a clear visual hierarchy.
How to Use It
This layout serves as a visual representation of data or concepts using candle shapes, suitable for illustrating progress or comparisons. It fits well in a presentation sequence after problem identification and before proposing solutions. Ideal for business scenarios such as performance tracking, project milestones, or symbolic representations of growth. The structured format allows for easy integration of text explanations alongside the visual elements, making it effective for engaging audiences.
Text Placeholders & Capacity
Keep your copy within these limits so it fits without resizing. Body slots are tight, roughly 10 words each.
| Placeholder | Count | Max characters (approx.) |
|---|---|---|
| Body paragraph | 5 | 50 |
Slide Keywords
Download unlimited PowerPoint templates, charts and graphics for your presentations with our annual plan.
DOWNLOADReturn to Candle Light Shapes & Charts for PowerPoint.