Slide 2 of 8 from Boston Consulting Group Matrix Template for PowerPoint
BCG Market Share Matrix for PowerPoint
Boston Consulting Group Matrix Overview
- Diagram
- Matrix Quadrant
- Strategic Analysis Slide
- 16:9
- 100% Editable
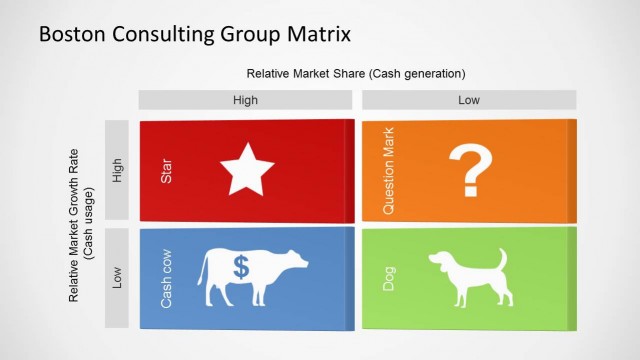
The Boston Consulting Group Matrix slide from the Boston Consulting Group Matrix Template for PowerPoint provides a clear visual tool for strategic analysis. This editable slide template uses a four-quadrant matrix to categorize products by market share and growth rate, supporting portfolio analysis and strategic planning within business presentations. Its design includes editable shapes and color-coded sections to enhance clarity in corporate presentation and pitch deck templates.
About This Slide
BCG Market Share Matrix for PowerPoint
What’s on This Slide
The layout features a four-quadrant matrix with two rows and two columns. The top row contains labels 'High' and 'Low' for market share, while the left column has 'High' and 'Low' for market growth rate. Each quadrant is filled with colored boxes labeled 'Star', 'Question Mark', 'Cash Cow', and 'Dog'. Text placeholders are positioned in the upper right and lower right corners for additional information. The overall color scheme includes red, orange, green, and blue for the quadrants, with a light background enhancing visibility.
How to Use It
This layout serves as a visual representation of the Boston Consulting Group Matrix, commonly used in portfolio management analysis. It fits within a presentation sequence that discusses strategic positioning and resource allocation. This structure is useful for businesses to categorize products or services based on market growth and share, aiding in decision-making regarding investment and development strategies.
Text Placeholders & Capacity
Keep your copy within these limits so it fits without resizing. Node labels can accommodate short phrases, roughly 2-3 words each.
| Placeholder | Count | Max characters (approx.) |
|---|---|---|
| Slide title | 1 | 30 |
| Item heading | 4 | 15 |
| Body paragraph | 2 | 100 |
Slide Keywords
Download unlimited PowerPoint templates, charts and graphics for your presentations with our annual plan.
DOWNLOADReturn to Boston Consulting Group Matrix Template for PowerPoint.