Slide 1 of 8 from Boston Consulting Group Matrix Template for PowerPoint
BCG Matrix for PowerPoint
Boston Consulting Group Matrix Overview
- Diagram
- Matrix Quadrant
- Strategic Analysis Slide
- 16:9
- 100% Editable
The Boston Consulting Group Matrix slide from the Boston Consulting Group Matrix Template for PowerPoint offers a clear four-quadrant layout ideal for strategic analysis in business presentations. This slide template supports product portfolio analysis and market share evaluation with editable shapes and vector icons, making it a practical choice for corporate presentations and pitch deck templates focused on resource allocation and growth strategies.
About This Slide
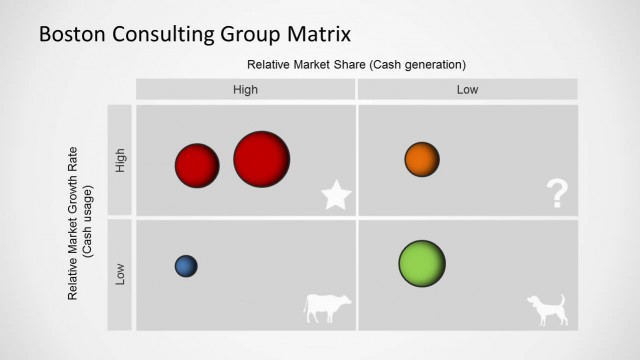
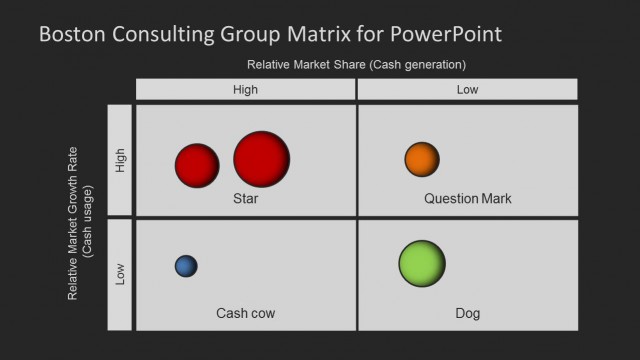
BCG Matrix for PowerPoint is a simple slide design for presentations on Boston Consulting Group to show the relative market share for business units or products. This slide design contains a nice BCG matrix created with PowerPoint and using relevant illustrations like the star, cow, dog and question mark.
What’s on This Slide
The layout features a four-quadrant matrix divided into high and low categories for relative market share and growth rate. Each quadrant contains labeled sections: Star, Question Mark, Cash Cow, and Dog, represented with distinct colors and icons. The top two quadrants are labeled 'High' and 'Low' for market share, while the left side indicates growth rate. Text placeholders exist for the title at the top and axis labels, aligned centrally. The overall composition is structured to facilitate comparison across the quadrants, with clear visual boundaries.
How to Use It
This layout serves as a strategic analysis tool for portfolio management, illustrating product positioning based on market share and growth potential. It fits early in a presentation sequence, following a problem-framing slide. This matrix is useful for businesses assessing product performance or investment opportunities, helping to visualize where resources should be allocated. It is particularly effective in discussions about product strategy and market analysis.
Text Placeholders & Capacity
Keep your copy within these limits so it fits without resizing. Node labels can hold roughly 2-3 words each.
| Placeholder | Count | Max characters (approx.) |
|---|---|---|
| Slide title | 1 | 30 |
| Item heading | 4 | 15 |
| Axis label | 2 | 25 |
Slide Keywords
Download unlimited PowerPoint templates, charts and graphics for your presentations with our annual plan.
DOWNLOADReturn to Boston Consulting Group Matrix Template for PowerPoint.