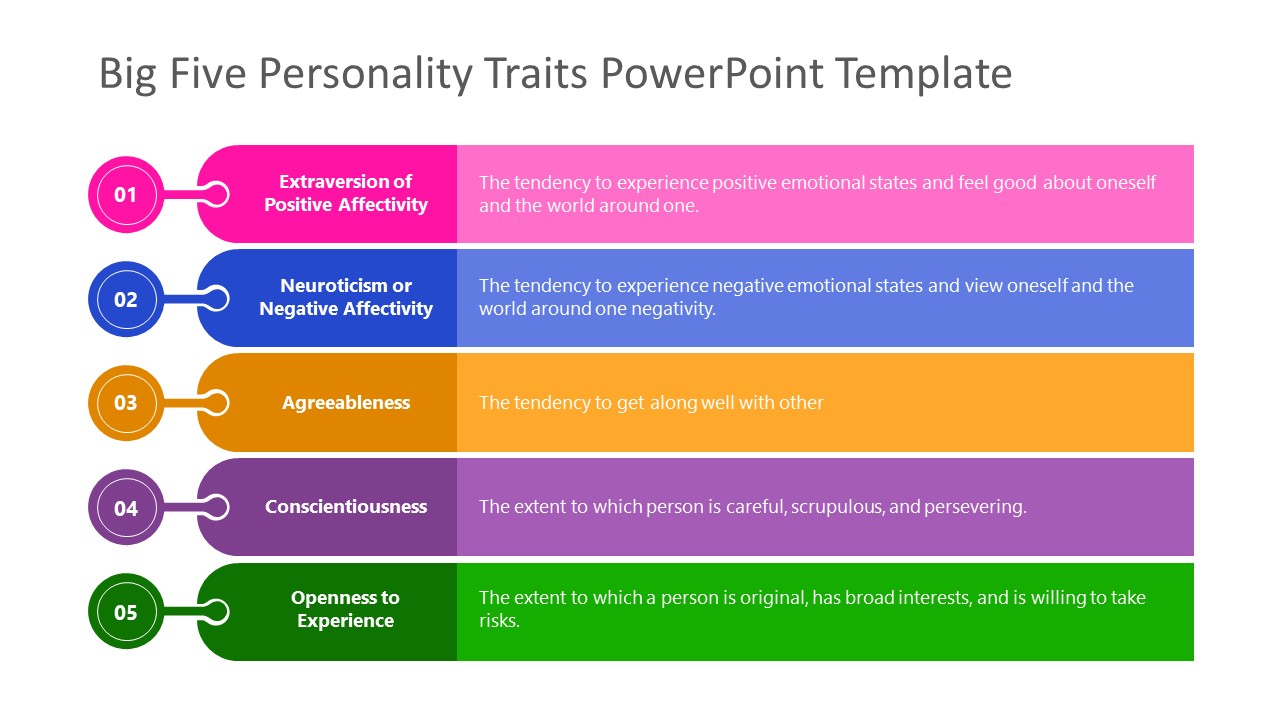
Big Five Personality Traits PowerPoint Template
The Big Five Personality Traits PowerPoint Template includes a visual illustration of individual personalities. 7 slides present the five-factory theory of personality traits in different layout designs. Users can choose from these slides to explain different parts of a personality. The PowerPoint template is a useful visual aid for educational presentations describing class personalities. In a business setting, the personality traits template defines growth strategies for staff. Human resources professionals use the 5 factors theory to define a person’s personality and how to motivate them.
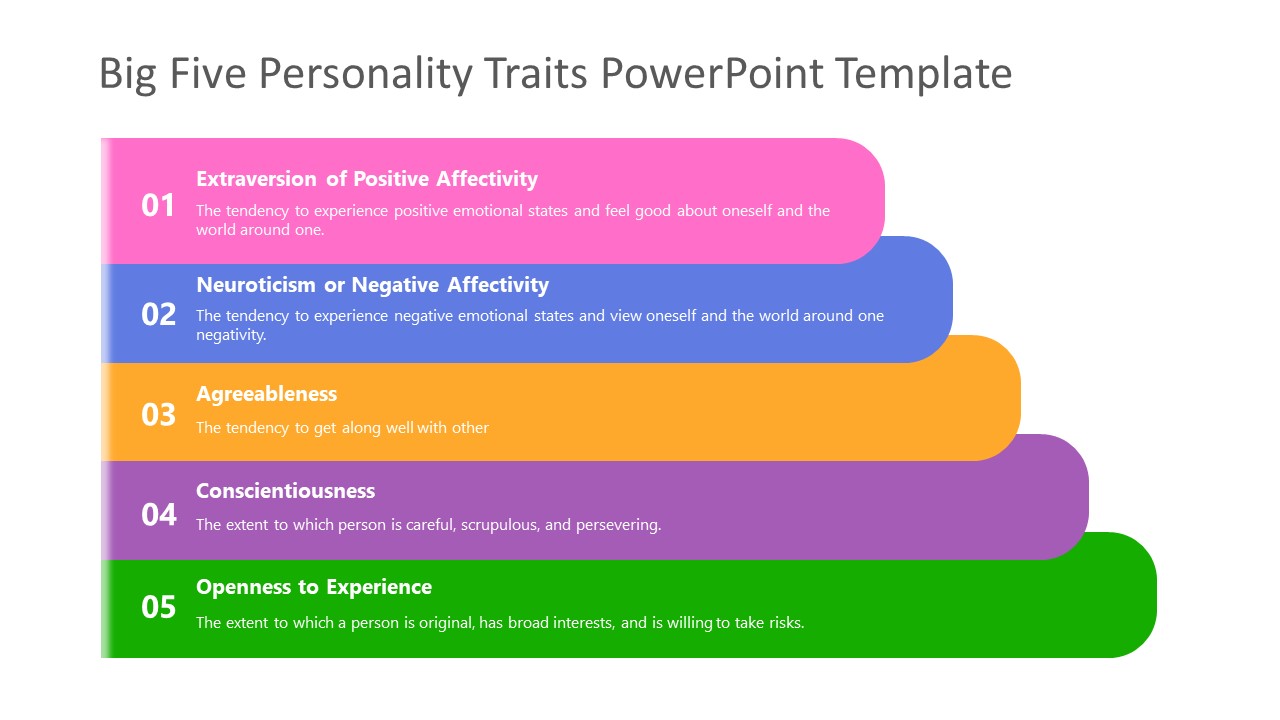
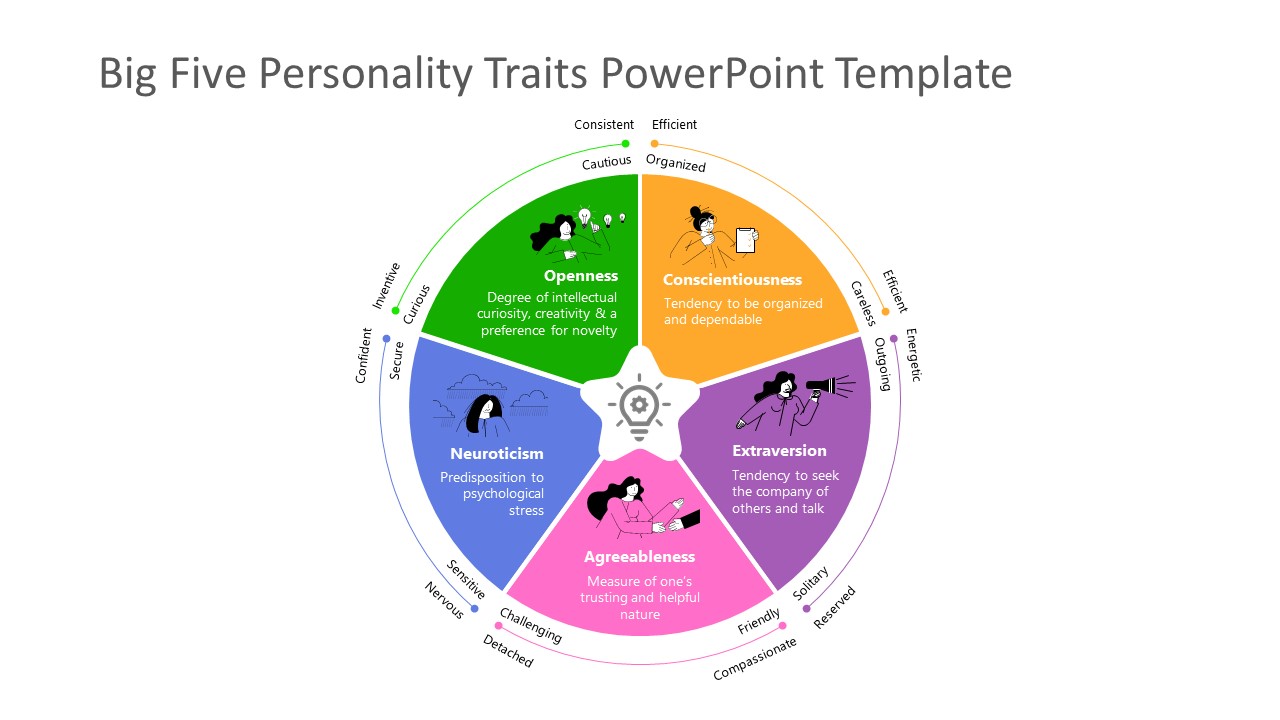
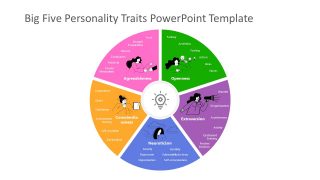
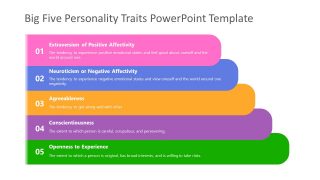
Big Five Personality Traits are the essential traits i.e. the building blocks of personality. The big five are broad categories of personality traits known as OCEAN (Openness, Conscientiousness, Extraversion, Agreeableness, and Neuroticism). These five personality factors represent a range between two extremes. For instance, Openness lies within the extremes of curious and cautious.
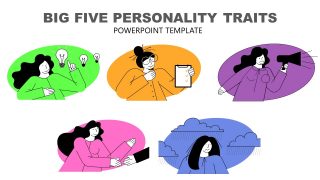
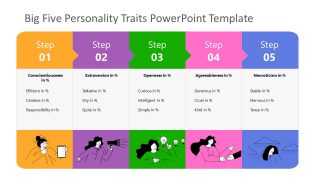
The Big Five Personality Trait PowerPoint template contains cartoon illustrations of Openness, Conscientiousness, Extraversion, Agreeableness, and Neuroticism. These cartoon characters visualize the behaviors of their respective personality traits. The 5-Step circular PowerPoint diagram shows the sub-traits that fall into these five categories. The colorful segments with cartoon figures make the presentation engaging for the audience. List-styled slides preset definitions of each personality trait. Users can customize the text placeholders to discuss behaviors and challenges relevant to the topic.
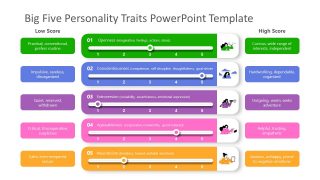
5 column Big Five Personality traits diagram template shows how personality of a person is defined by big five. This PPT diagram can display trait values in percentage to analyze a person’s personality profile. The individuals ranked on a scale between two extremes, the circular chart of these ranks displays traits that fall in between. The slide of scale rate shows how personalities are measured between low and high scores of big five personalities. Alternatively, check our collection of cartoon PowerPoint templates.


You must be logged in to download this file.
DOWNLOAD- Category
- Strategy
- Rating

 Loading...
- Size
- 16x9
- Item ID
- 40105-03
- Colors
Subscribe today and get immediate
access to download our PowerPoint templates.