Animated 5 Numbered Steps Process Infographic
Showcase the project roadmap sequence in your stakeholder presentations with our Animated 5 Numbered Steps Process Infographic. A digital marketing manager can edit the animated numbered steps diagram for their campaign planning presentations to highlight different execution phases. For instance, they can talk in detail about: research, planning, content creation, distribution, and performance. Program coordinators can use our step-by-step animated diagram to visualize the workflow stages in a clear, sequential format. This allows them to reveal each stage at a time, making it easier for cross-functional teams to communicate.
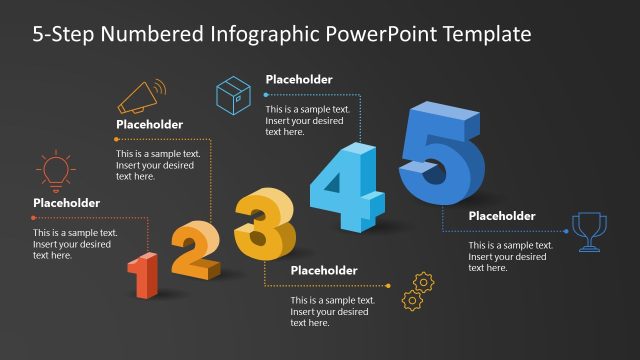
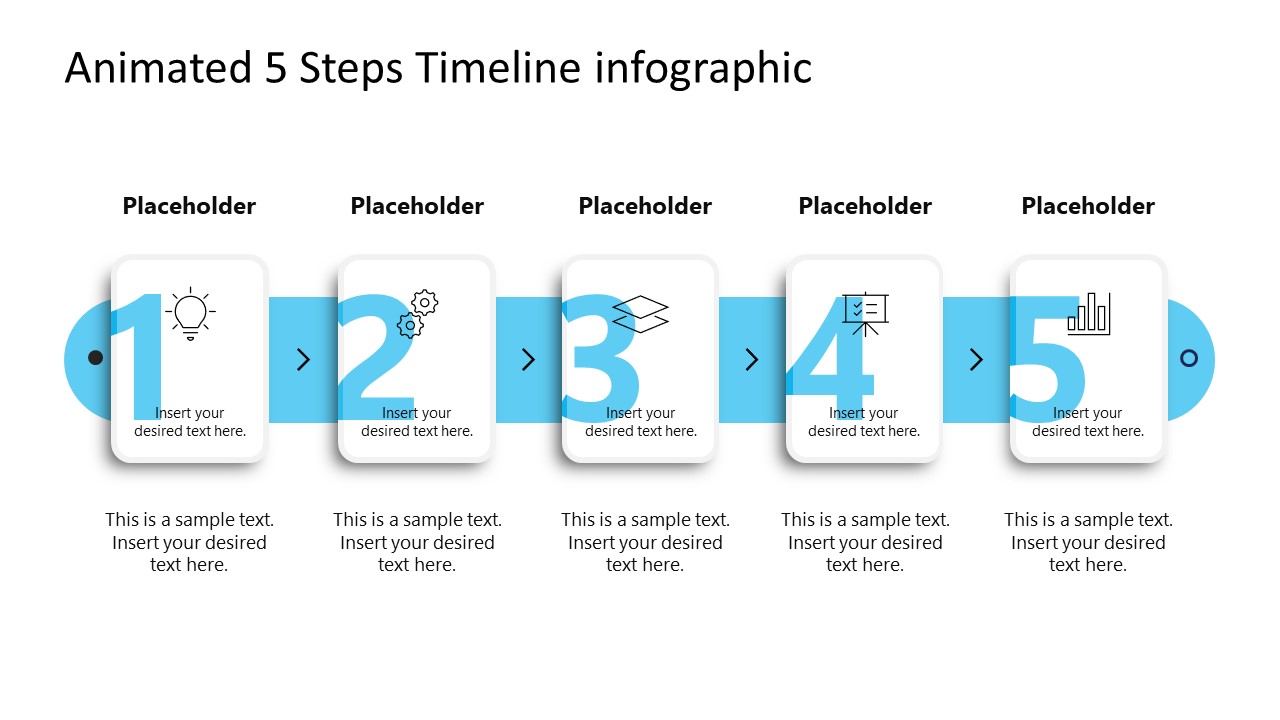
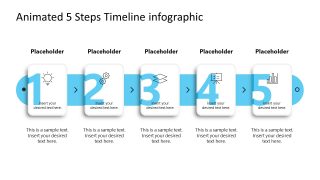
The Animated 5 Numbered Steps Process Infographic features a sleek, animated 5-step process diagram with 5 containers. The diagram shows five rectangular cards with rounded edges placed vertically over a blue line. The blue line in the background illustrates the connection between the steps. The arrows in the empty spaces help show the direction of the process. Users can also mark the start and end points of the business strategy using this layout. The animated PPT template enables presenters to showcase each stage progressively, communicating the information in a constant pattern. During the animation, the cards appear at once, then a blue line appears from left to right, with text and icons falling toward the center.
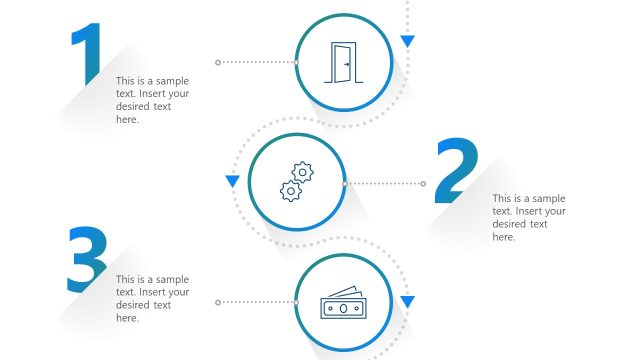
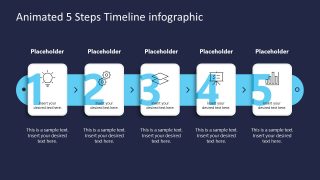
In process walk-throughs or project presentations, managers can highlight the key steps for effective project completion using this numbered PPT template. The first slide has a white background, while the second slide shows similar components and a numbered diagram on a dark background. Also, we have provided users with the option to modify the graphical layout, such as colors and shapes, to match their brand. Download the animated 5-step process infographic template to simplify complex ideas and engage your audience. Try our creative numbered diagram templates to clearly present a structured workflow in your business presentation.

You must be logged in to download this file.
DOWNLOAD- Category
- Diagrams
- Rating

 Loading...
- Size
- 16x9
- Item ID
- 23624-02
- Colors
Subscribe today and get immediate
access to download our PowerPoint templates.