Slide 10 of 15 from AI Digital Transformation PowerPoint Template
Data & Analytics Integration Slide – AI Transformation Template
Data & Analytics Integration Slide
- Chart
- Bar Vertical
- Data Findings Slide
- 16:9
- 100% Editable
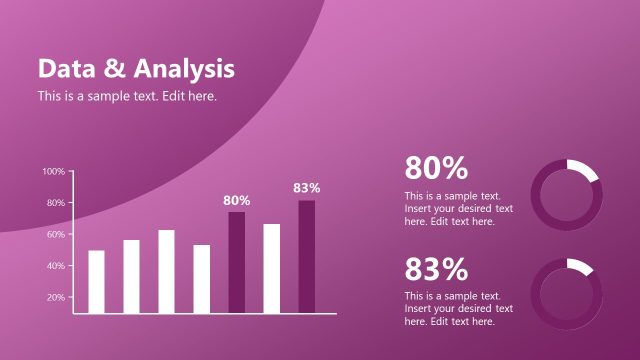
The Data & Analytics Integration slide from the AI Digital Transformation PowerPoint Template offers a clear bar chart layout ideal for presenting data trends and analytics insights. This slide layout supports business presentations and pitch deck templates by combining editable shapes and vector icons to visualize data-driven findings effectively. It is designed to enhance corporate presentations focused on digital transformation and analytics integration over time.
What’s on This Slide
The slide features a bar chart positioned centrally, displaying data percentages across several years from 2090 to 2094. The chart uses a mix of dark and purple bars, with the largest bar representing 56%. Above the chart, a title is aligned left, stating 'Data & Analytics Integration.' Below the title, there are two text placeholders aligned right, each with rounded corners, allowing for additional information. To the right, an image placeholder shows a figure interacting with a digital interface. The overall layout is balanced, with elements grouped for clarity.
How to Use It
This layout serves as a data visualization tool, effectively presenting analytics integration over time. It fits well in a presentation sequence after discussing business challenges and before outlining benefits. This slide is suitable for scenarios where data-driven insights are necessary, such as strategy meetings or stakeholder updates. It can also be used to illustrate trends in data analytics for AI implementation, making it relevant for business leaders and consultants focused on digital transformation.
Text Placeholders & Capacity
Keep your copy within these limits so it fits without resizing. Body slots can accommodate roughly 15-20 words each.
| Placeholder | Count | Max characters (approx.) |
|---|---|---|
| Slide title | 1 | 30 |
| Body paragraph | 3 | 100 |
| Item heading | 5 | 10 |
Slide Keywords
Download unlimited PowerPoint templates, charts and graphics for your presentations with our annual plan.
DOWNLOAD