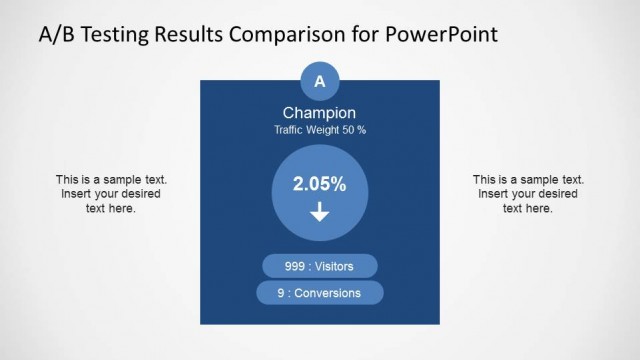
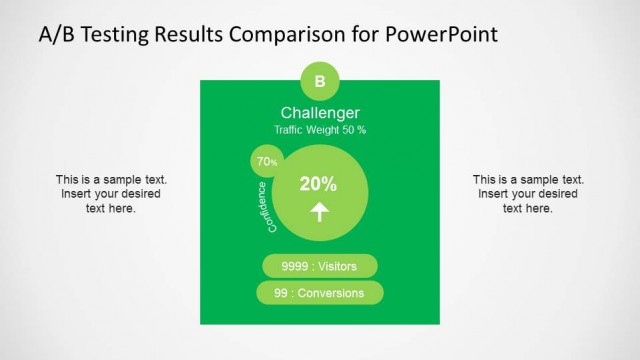
A/B Testing Results PowerPoint Comparison Table

Champion and Challenger A/B Testing Results

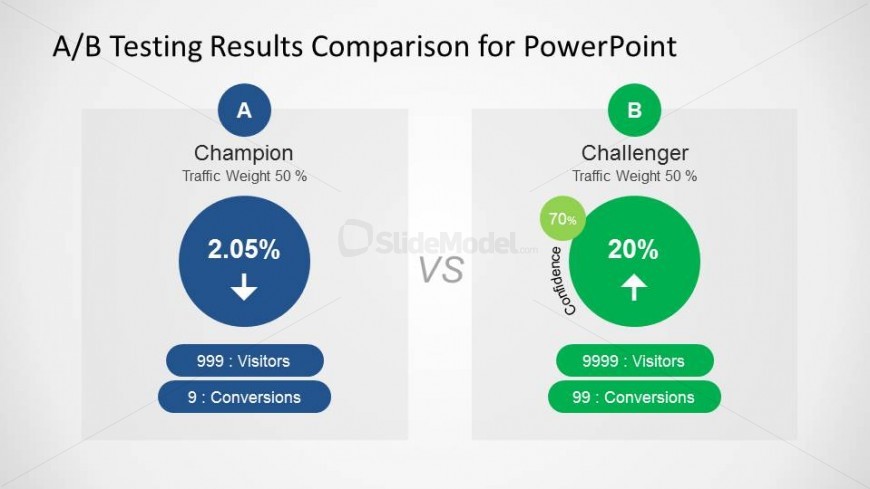
This slide provides a professional comparison table for Champion and Challenger versions of a system under A/B Testing. Each table provides a textbox for Visitors and Conversions Metric. The center of the table contains the percentage of comparison (generally conversion goals defined prior to the test). At the top of the table the amount (%) of traffic of the sample of each version.

Return to A/B Testing Results Comparison for PowerPoint.

Activate your subscription

Download unlimited PowerPoint templates, charts and graphics for your presentations with our annual plan.

DOWNLOAD

Slide Tags:

A/B Testing Blue Challenger Champion Confidence Conversions Goal Green Results Split Split Testing Statistical Testing Traffic Visitors Weight

Return to A/B Testing Results Comparison for PowerPoint.

Download Unlimited Content

Our annual unlimited plan let you download unlimited content from SlideModel. Save hours of manual work and use awesome slide designs in your next presentation.

Subscribe Now