Slide 1 of 2 from 8 Sets Venn Diagram PowerPoint Template
Multicolor 8 Sets Venn Diagram Template
8 Set Venn Diagram for PowerPoint
- Diagram
- Venn
- Comparison Slide
- 16:9
- 100% Editable
What’s on This Slide
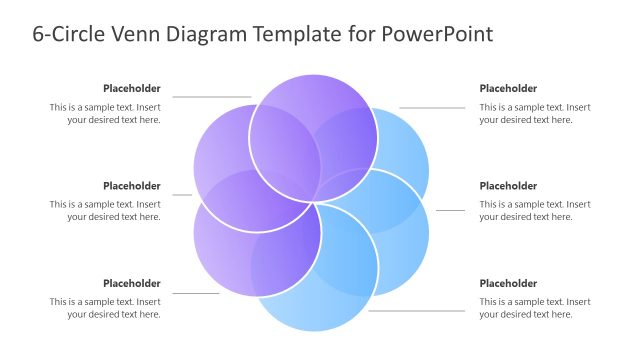
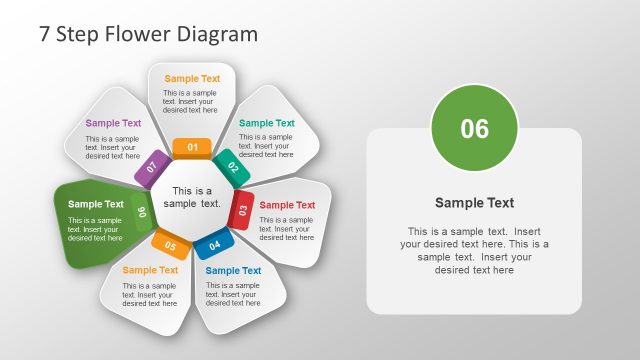
The layout features a central circular diagram with eight overlapping shapes, each representing a set. The shapes are colored in shades of blue, green, yellow, and orange, creating a visually distinct pattern. Each shape contains a text placeholder aligned to the center, with additional text placeholders positioned at the top and bottom of the diagram. The overall composition is symmetrical, with a clear visual hierarchy emphasizing the central intersection of the sets. The background is white, ensuring clarity and contrast with the colorful shapes.
How to Use It
This layout serves as a multi-set comparison tool, ideal for illustrating relationships among eight distinct groups or data sets. It fits well in presentations discussing logical reasoning, data analysis, or similarity assessments. This diagram can be used in business contexts such as market analysis, product comparisons, or strategic planning. It is effective for visually representing complex intersections and shared characteristics among multiple categories, enhancing audience understanding of intricate relationships.
Text Placeholders & Capacity
Keep your copy within these limits so it fits without resizing. Node slots can hold concise text, roughly 5-6 words each.
| Placeholder | Count | Max characters (approx.) |
|---|---|---|
| Item body | 8 | 30 |
| Body paragraph | 2 | 150 |
| Slide title | 1 | 30 |
Slide Keywords
Download unlimited PowerPoint templates, charts and graphics for your presentations with our annual plan.
DOWNLOADReturn to 8 Sets Venn Diagram PowerPoint Template.