5×5 Risk Matrix PowerPoint Template
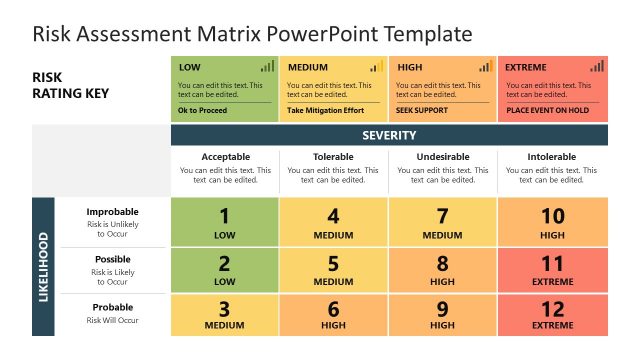
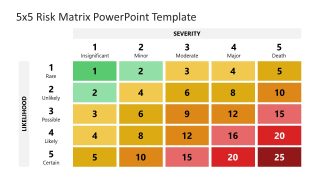
Download our editable 5×5 Risk Matrix PowerPoint Template to discuss the likelihood and severity of impending risks. Risk assessment is essential before considering adopting, implementing, or beginning anything. It can be a new project or an innovative implementation strategy; in everything, there is a need to evaluate the risks & their intensity. To make this process more straightforward for communication with the team members, the 5×5 matrix is readily adopted by professionals. In this matrix chart, they can rate a risk from 1 to 5 based on their severity and likelihood. The resultants of these ratings from both aspects can be calculated by multiplying them. By making this chart for risk analysis, presenters can quickly determine the nature of the impending risk and prepare mitigation plans accordingly.
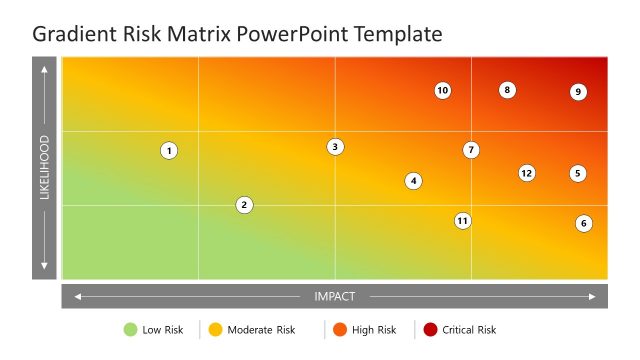
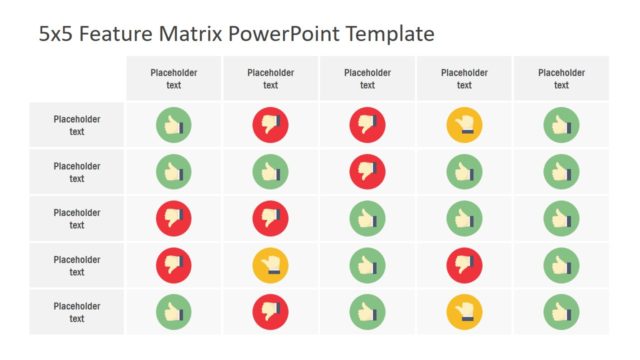
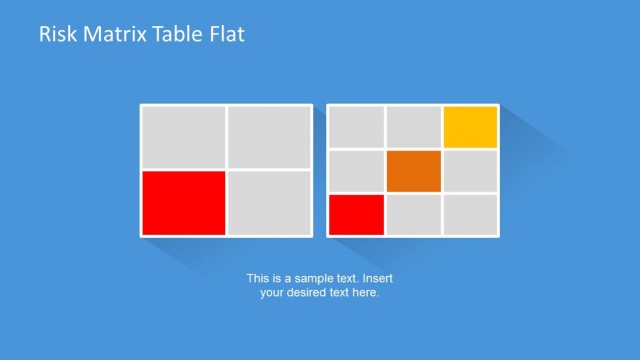
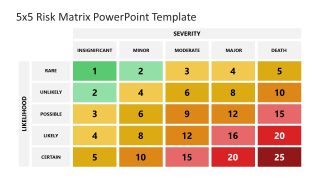
In this 5×5 Risk Matrix PowerPoint Template, we have provided a 5×5 matrix chart. The x-axis of this matrix represents the severity and has five columns, each having a specific value (from 1 to 5). Also, the rows indicate the likelihood. We added a phrase to showcase what these levels mean, making it easier for the presenters to arrange their information. The blocks in the area of the matrix are colored according to the comparative intensity & likelihood value of the risk. For instance, the first three blocks are green, indicating mild or no risk. Similarly, the next color is light yellow for the multiplied values of 3, 4, & 5. This color’s shade darkens until it becomes red for the values of 20-25. So, presenters can communicate various risk factors and showcase their intensity with this color-coded matrix chart.
Presenters can edit this PPT template by editing the text boxes and preparing their presentations by choosing from both slides. The slides vary slightly in design and can be customized by the users. Download and try this template for your presentations about risk assessment and management.


You must be logged in to download this file.
DOWNLOAD- Category
- Matrix Charts
- Rating

 Loading...
- Size
- 16x9
- Item ID
- 22864-01
- Colors
Subscribe today and get immediate
access to download our PowerPoint templates.