5×5 Feature Matrix PowerPoint Template
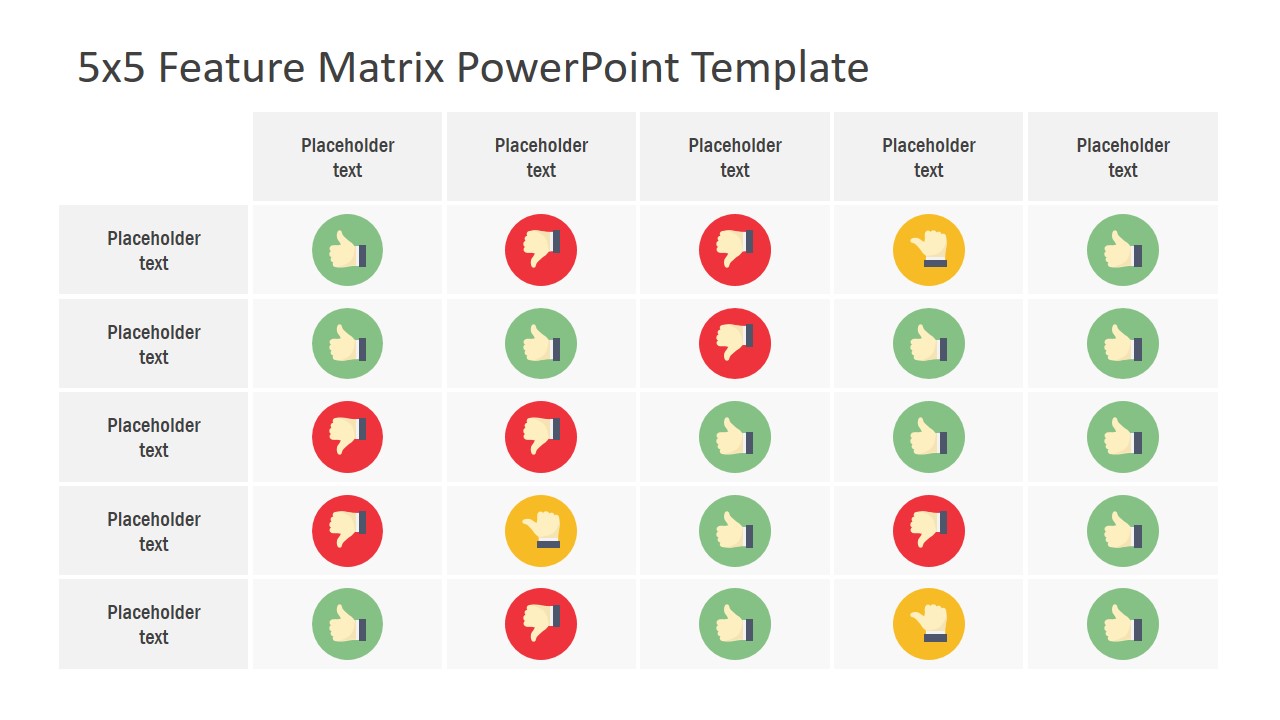
The 5×5 Feature Matrix PowerPoint Template is a business and management presentation diagram. The template contains three slides of matrix designs with 5 rows and columns. The 5X5 cells of these rows and columns show three graphic icons to represent categories. Originally, the PowerPoint matrix diagram includes three categories using thumbs-up clipart in different circular icons. It is an ideal presentation tool for compatibility matrix model. But minor changes in icons can also help create a RACI matrix of management. This PowerPoint matrix diagram, which is part of the RACI Chart Template, helps to reuse the template for various capability analysis presentations.
The 5X5 Feature Matrix PowerPoint Template includes two layouts with different color schemes. It enables users to make further changes in the basic data table. Such as colors, text fonts, replacing clipart, etc. It will demonstrate professionalism and engage audience through well design and simplified chart of information. Furthermore, a single view of intersection between two variables effectively communicates underlying ideas. Therefore, professionals including executives, consultants, entrepreneurs, bankers, academic professors, etc. can benefit from the matrix diagram tool in PowerPoint.
The matrix PowerPoint template contains 5X5 cells that can also describe project management life cycle. For example, planning, initiation, execution, monitoring, and delivery of project. Whereas, the rows could present process milestones or resources. The table format of data presentation helps clearly define roles and responsibilities of team.


