5-Way Converging Infographic PowerPoint Template
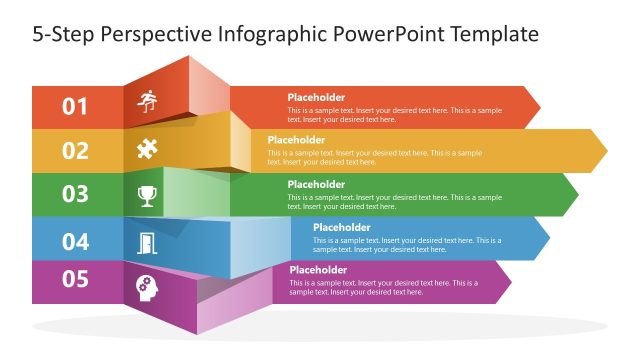
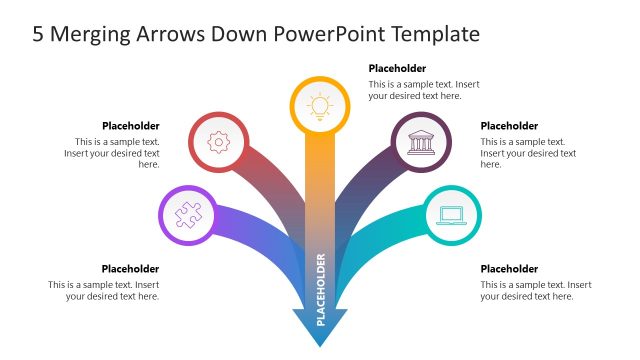
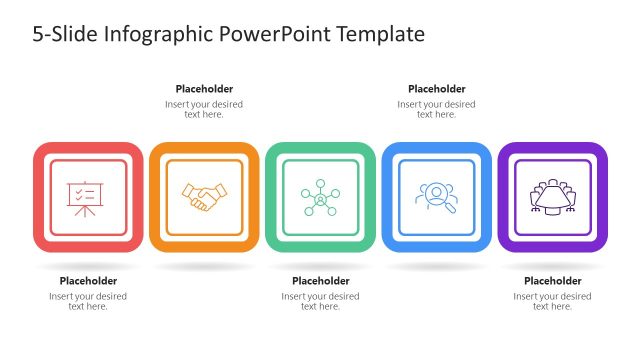
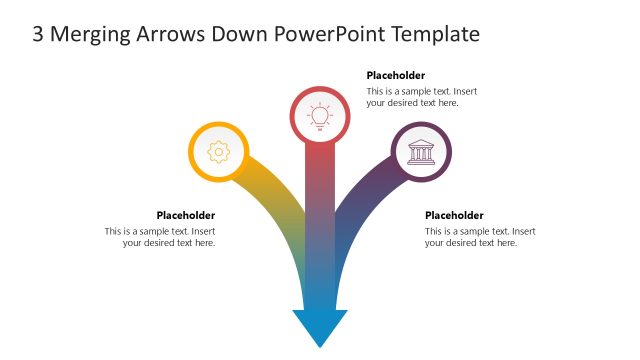
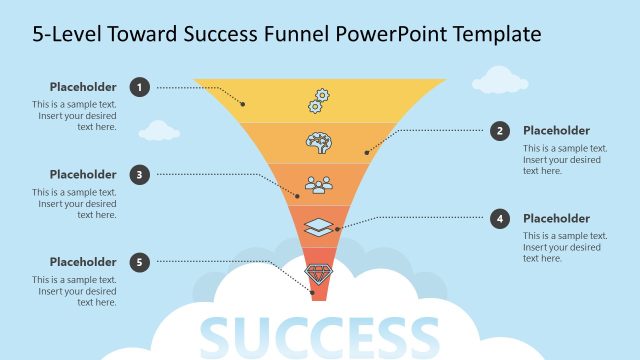
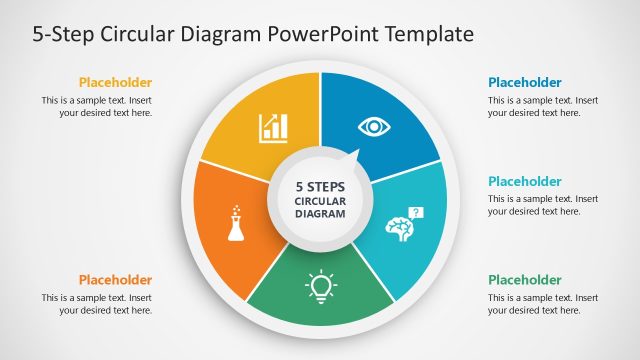
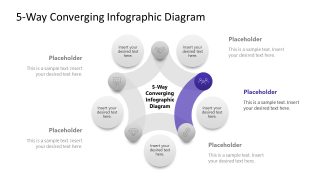
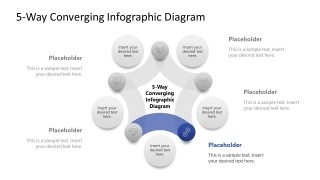
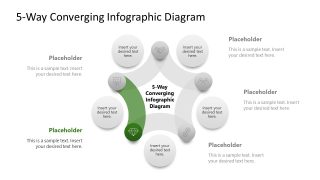
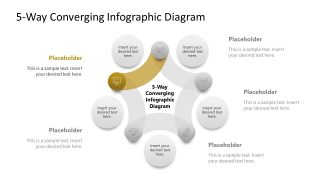
Use our 5-Way Converging Infographic PowerPoint Template in a business planning presentation to clearly demonstrate the factors contributing to overall efficiency. The converging diagram illustrates five factors that act simultaneously rather than sequentially to achieve a specific outcome. But users can also repurpose the design to showcase a series of steps. The five curved bars of the pentagon shape help project managers communicate the key actions for each milestone. They can use circular infographics to visually display content in their team presentations. There is a circular shape with text at the center of the curve, along with placeholder text sections for each step. In the following slides, the converging diagram focuses on one point at a time, enabling the audience to grasp each program area effectively.
For instance, digital marketing strategists can use the converging diagram template to highlight paid and organic marketing channels that contribute to brand success. In a management consultation presentation, the presenter shares the five-step transformative roadmap to improve customer experience and product delivery. The 5-Way Converging Infographic PowerPoint Template helps him clearly outline each step to leadership. The chief operational officer can use the converging diagram to illustrate how the efficiency of five parallel workstreams can contribute to a single cost-reduction goal. In academic research, the five curved sides of the diagram depict collaboration across multiple departments to achieve the overall research outcome. Also, we provide the users with the ability to customize the design on any version of Microsoft PowerPoint.
Download the 5-way converging infographic diagram template to illustrate the five pillars of the new strategic initiative in your business presentations. Alternatively, download other converging arrow diagrams for PowerPoint and Google Slides.


You must be logged in to download this file.
DOWNLOAD- Category
- Diagrams
- Rating

 Loading...
- Size
- 16x9
- Item ID
- 23619-01
- Colors
Subscribe today and get immediate
access to download our PowerPoint templates.