5-Step Test Tubes PowerPoint Infographic Template
Use our 5-Step Test Tubes PowerPoint Infographic Template featuring an animated design to display numerical data or values. This easy-to-customize template is equally suitable for all professional and academic presentations. A smooth color scheme is used throughout the template to grab the audience’s attention, promoting clear communication of the presented idea. The template has three slides with editable text areas to accommodate the relevant descriptions. Presenters can conveniently edit the slides with PowerPoint and Google Slides.
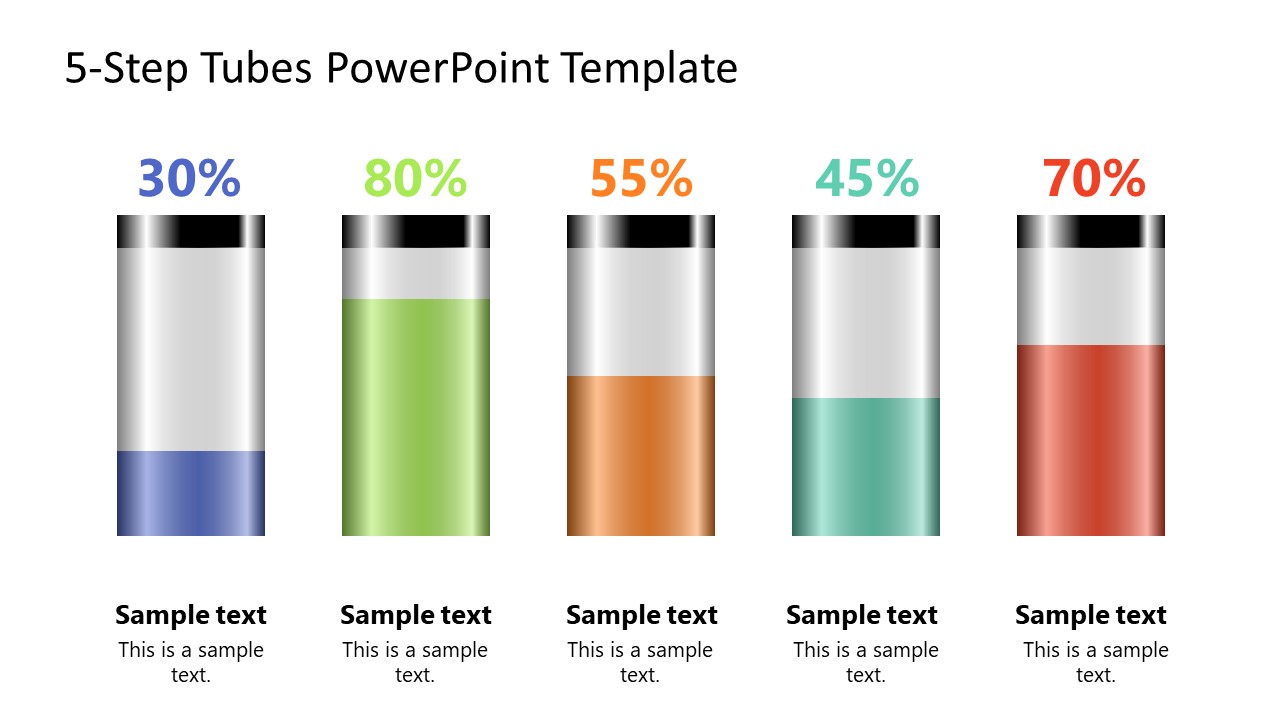
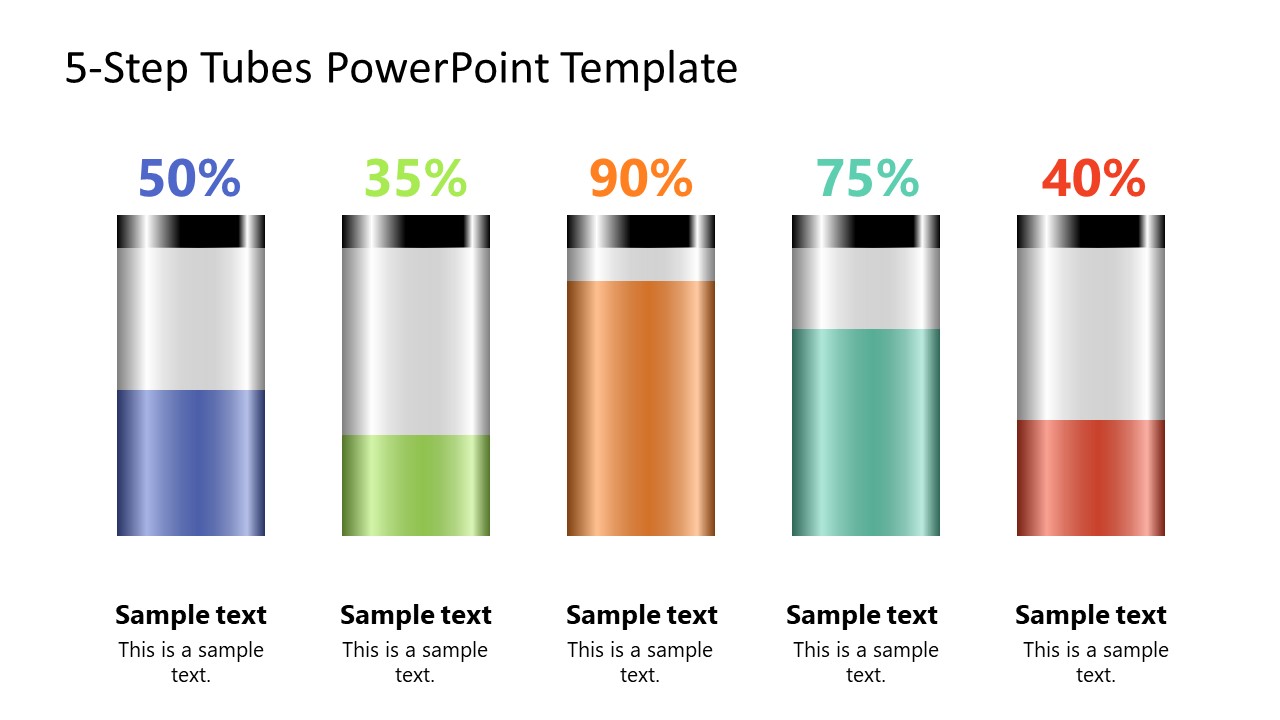
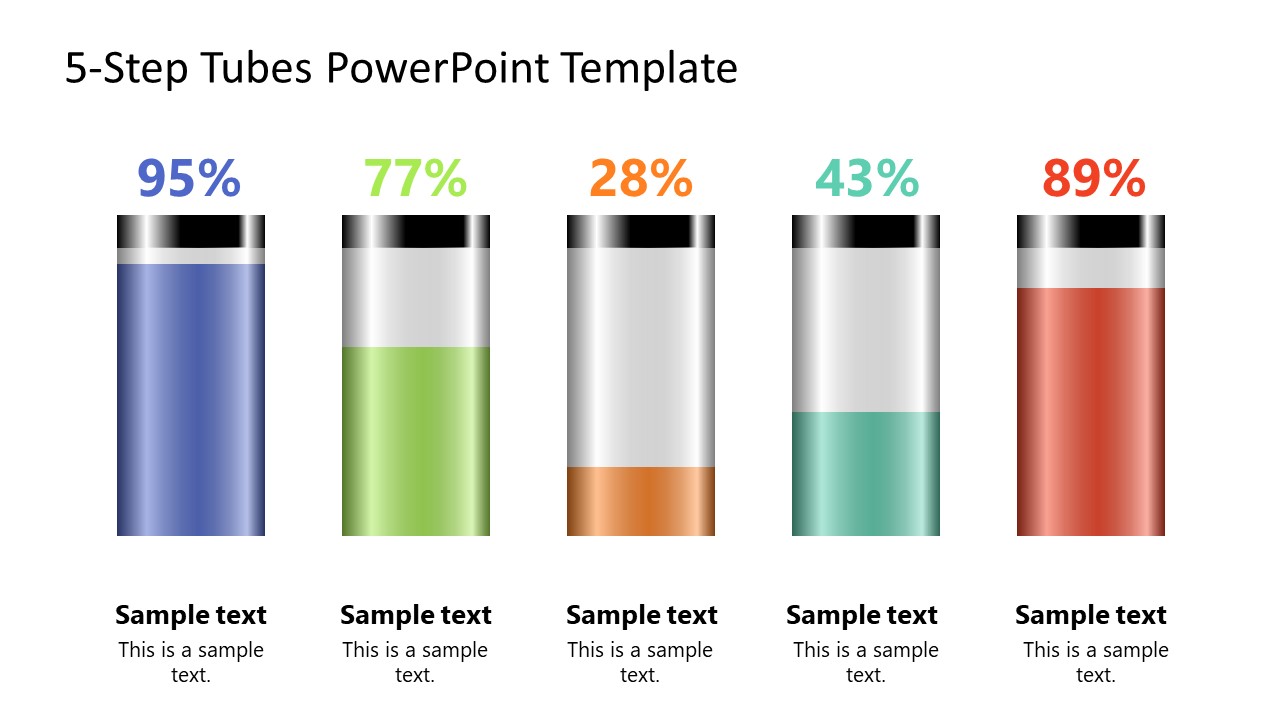
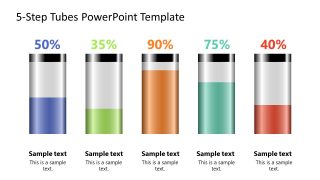
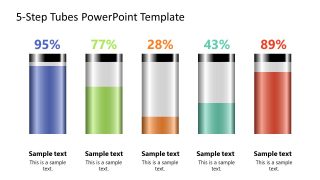
The 5-Step Test Tubes PowerPoint Infographic Template slide shows five test tubes arranged in a horizontal queue. Colored text boxes are used in the test tube, indicating colored fluid in the tubes. The level of this liquid illustration corresponds to the mentioned percentage. For instance, the test tube with 80% has colored liquid almost up to the edge. Using the Morph transition effect, we have created the test tube filling scene, i.e., on a slide show, the test tubes will get gradually filled up to the mark through this animation. The 3D look is created using multiple color shades on the test tube diagram. Presenters can also change the color of each test tube and alter the length of the colored part according to the presented values. Each of the three template slides provides a different set of presented values that are editable.
Our 5-step test tube template can be used in various scenarios. Business professionals can indicate the completion of multiple projects through this design. Science presenters can relate this infographic to show the results of their lab experiments. Similarly, research scholars can customize this fully editable diagram for their presentations. In addition, this animated slide template can be used by marketing or finance professionals to showcase the analysis data. So, our users can apply this creative 5-step test tubes PowerPoint template according to their requirements.
