5-Scale Likert Infographic PowerPoint Template
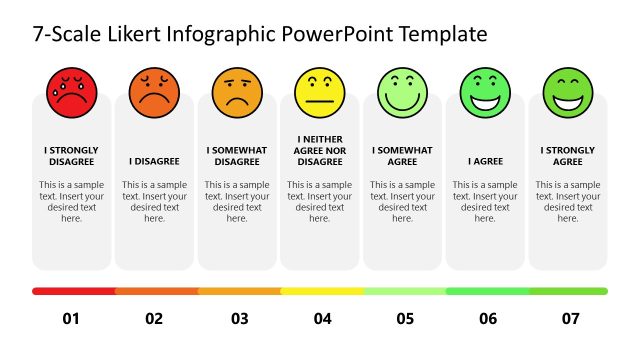
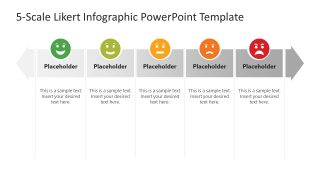
Present the product satisfaction or customer review analysis in the executive meetings with our 5-Scale Likert Infographic PowerPoint Template. A Likert scale is a survey tool that has five answer options that help professionals measure opinions or feelings. The scale ranges from opposing extremes to positive extremes, i.e., strongly disagree to agree strongly. It uses colors, icons, or emojis to accurately visualize the score. The middle point of the Likert scale is neutral. Professionals can also use this template to demonstrate public sentiment during awareness sessions. They can discuss the service quality survey results in the stakeholder sessions to help them make better decisions for their company based on the outcomes. We have created this template for professionals to mention their analytics and viewpoints effectively. The range includes the following levels:
- Strongly Disagree
- Disagree
- Neutral
- Agree
- Strongly Agree
Professionals in the academic domain can use these slides in their presentations to easily express thoughts or sentiments. Our 5-Scale Likert Infographic PowerPoint Template has a creative layout with a double-headed arrow diagram. The arrow has five segments, each with title text and an emoji at the top. Below it, professionals can edit the placeholder text in each column to visualize the details. The green color indicates satisfaction, while red indicates dissatisfaction. Next, the second slide shows colored segments of the arrow diagram by level, with colorful emojis. You can customize the template’s colors and other elements to fit your needs perfectly. Download our Likert infographic PPT slide template and discuss the level of satisfaction of the customers or clients in your executive meetups. Grab it today!


You must be logged in to download this file.
DOWNLOAD- Category
- Diagrams
- Rating

 Loading...
- Size
- 16x9
- Item ID
- 23363-01
- Colors
Subscribe today and get immediate
access to download our PowerPoint templates.