Slide 2 of 2 from 5-Scale Likert Infographic PowerPoint Template
Editable 5-Scale Likert Infographic Presentation Template
5-Scale Likert Infographic PowerPoint Template
- Diagram
- Comparison Split
- Evaluation Slide
- 16:9
- 100% Editable
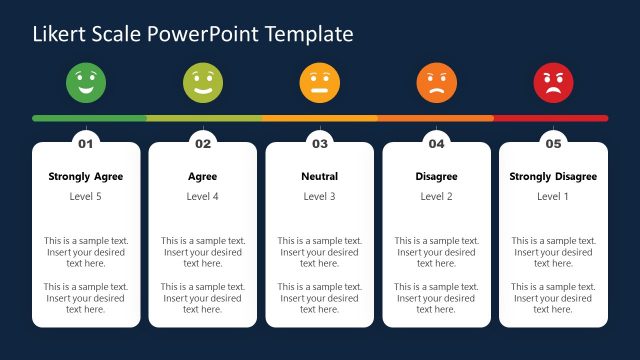
The 5-Scale Likert Diagram slide from the 5-Scale Likert Infographic PowerPoint Template provides a clear visual tool for presenting customer feedback and employee survey results. Featuring editable shapes and vector icons arranged horizontally, this slide layout supports effective sentiment evaluation in business presentations or pitch decks. Its design facilitates easy interpretation of opinion polling data within professional slide decks.
What’s on This Slide
The layout features five colored sections aligned horizontally, each containing a circular emoji icon representing different levels of sentiment. The icons range from green for positive to red for negative. Each section has a text placeholder positioned below the emoji, aligned centrally. A directional arrow points to the right, indicating progression. The background is white, enhancing the visibility of the colored sections and icons. The overall composition is structured to guide the viewer's eye across the scale from left to right.
How to Use It
This layout serves as a visual representation of a Likert scale, useful for gauging opinions or feedback. It fits well after a problem-framing slide, allowing for a clear presentation of responses. This structure is ideal for surveys, customer satisfaction assessments, or employee feedback sessions, where visual sentiment analysis is required. It can be used in various business contexts to summarize data effectively.
Text Placeholders & Capacity
Keep your copy within these limits so it fits without resizing. Node body slots can hold roughly 30 characters each.
| Placeholder | Count | Max characters (approx.) |
|---|---|---|
| Item body | 5 | 30 |
Slide Keywords
Download unlimited PowerPoint templates, charts and graphics for your presentations with our annual plan.
DOWNLOAD