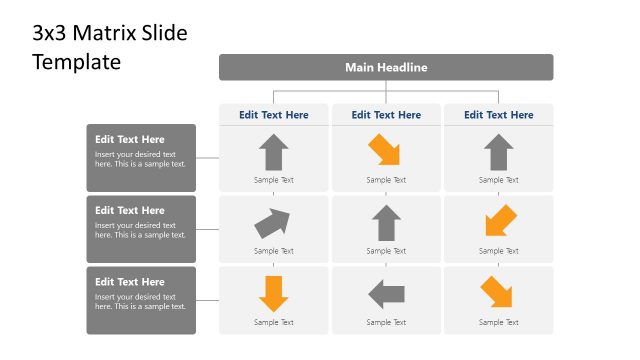
Slide 1 of 2 from 3x3 By The Numbers PowerPoint Template
Customizable 3×3 By The Numbers PPT Template
3x3 KPI Overview Slide
- Table
- Comparison Table
- Kpi Reporting Slide
- 16:9
- 100% Editable
The 3x3 KPI Overview slide from the 3×3 By The Numbers PowerPoint Template offers a structured layout for presenting key performance indicators in a clear 3x3 grid format. This slide is designed for business presentations and performance reviews, featuring editable shapes and vector icons to enhance data visualization. It supports concise KPI reporting, making it a practical choice for corporate presentations and slide decks that require straightforward numerical summaries.
What’s on This Slide
The layout consists of a 3x3 grid displaying key performance indicators. Each cell contains a number and a label, with the first row featuring larger text for emphasis. The first cell shows '150+' with the label 'KPI NUMBER ONE', while the second cell has '30' and an icon, followed by '15,000+' and 'KPI NUMBER THREE'. The second row includes '749' and 'KPI NUMBER FIVE', with the third row showing '95' and 'KPI NUMBER SEVEN'. Text placeholders are present for additional data, aligned centrally within each cell. The overall color scheme uses red for numbers and black for labels.
How to Use It
This layout serves as a summary of key performance indicators, ideal for presenting numerical data in a clear format. It fits well in a presentation sequence after introducing a topic or problem, providing a concise overview of metrics. This slide is useful for business reviews, performance assessments, or KPI tracking. It allows for quick visual comparisons between different metrics, making it suitable for stakeholder meetings or reports where clarity is essential.
Text Placeholders & Capacity
Keep your copy within these limits so it fits without resizing. Each cell can hold a number and a label, roughly 2-4 words each.
| Placeholder | Count | Max characters (approx.) |
|---|---|---|
| Item body | 9 | 20 |
Slide Keywords
Download unlimited PowerPoint templates, charts and graphics for your presentations with our annual plan.
DOWNLOADReturn to 3x3 By The Numbers PowerPoint Template.